Rotea Protocol Review Tool - Context Help
Purpose:
For Rotea protocol developers who want to know what can go wrong—and fix it before it does.
Support protocol developers to create Trip Assurance when deploying Rotea applications.
Trip Assurance means confidence that a protocol will run to completion as intended, without avoidable interruptions, preventable failures, or unanticipated operator intervention.
This tool approaches this by loading a Rotea protocol and comparing it against established best-practice guidelines through analysis and simulation.
Intent:
Assist Rotea users in building robust, reliable applications by:
- identifying process risks highlighting strategies to reduce them.
- identifying points of systematic cell loss that can be refined.
What It's Not:
This tool does not create or modify protocol files. To make changes, use the Rotea Protocol Builder.
It is not a real-world execution environment and does not replace instrument qualification, process validation, or release testing with real cell product.
Why:
The primary goal is to reduce the risk of failed or disrupted runs by helping users detect potential issues before execution.
By highlighting guideline deviations, sensitivity to input variability, and known operational hazards, the tool supports informed, risk-based decision-making and greater confidence that a protocol will complete successfully under real-world conditions.
In regulated and clinical development settings, this tool is intended to be used during protocol development and review, prior to protocol lock-down, to support risk identification, process understanding, and design refinement. Final protocol approval, validation, and release decisions remain the responsibility of the user’s established quality systems.
Overview
This application:
Reads the Rotea protocol file created by the Rotea Protocol Builder.
Analyses the protocol through four simulation functions:
- structure of the raw protocol definition
- Volume modelling through algorithms
- Detailed volume simulation emulating the sequence
- The interaction of cell like particles to the chamber conditions.
Creates a Summary report being a high level review:
- Starting conditions including pre-saved settings.
- A review of the priming sequence.
- Volume and cell simulation based performance assessments.
- An aggregated risk analysis evaluation (FMECA score.)
Creates a report recommending changes for improvement of the protocol based on guidelines.
- Guidelines are a suite of 'best practice' behaviours developed through a risk-based approach.
- As the simulation is progressed, conditions where a guideline can be assessed are traversed.
- Hard coded checks compare the conditions to the guideline settings.
- A Guideline Report is generated if non-compliance is recognised.
Supports the user to create a documented Change Plan.
- Facilitates a documented, iterative development process.
What to Expect
It is common to find guideline issues in protocols.

If the volume simulation is completed with no guideline conflicts,
our rather concerned face becomes:

The goal of this tool is to help you achieve this happy face - In the protocol and on the face of your QA Director.
Beyond the Basics: Exploring Insights
This application isn’t just about compliance; it also provides insights into protocol performance:
Parameters: Exploring settings to align with process requirements.
Reagent Requirements: Estimate the reagent volumes and output bag capacities needed.
Priming Functions: Evaluate priming performance and identify remaining process hazards.
Cell Input Variation: Analyze how variations in input bag volume and cell concentration affect performance.
Cell Dynamics: Visualize the accumulation and elutriation of cells within the chamber.
Cell Loss Patterns: Identify sources of systematic cell loss.
Cell Recovery Score: Evaluate the process success score that quantifies cell recovery performance.
The Role of Guideline Recommendations
The primary purpose of these activities is to evaluate the protocol against best-practice guidelines.
- As the simulation progresses, the tool identifies steps where protocol behavior deviates from guidelines.
- Guideline Reports are generated for each detected deviation.
- These reports are accessible alongside the step listing, allowing you to review and act on the findings.
Interacting with Guideline Reports
When you open a Guideline Report, you can:
- Add Comments: Document observations or decisions.
- Commit a Recommendation: Accept the guideline’s suggestion as a planned protocol change.
- Suppress the Guideline: Discount this consideration for the current step.
- Committing or suppressing a report will drop any error state and allow the simulation to proceed.
Committed recommendations appear in the Change Plan Report, that:
- Aggregates all planned changes for easy tracking.
- Can be printed to PDF for documentation and quality assurance purposes.
Iterative Refinement
This guideline interaction process enables continuous protocol improvement:
- Run the simulation and review the guideline reports.
- Commit or suppress recommendations based on process requirements.
- Edit the protocol using the Rotea Protocol Builder.
- Re-analyze the updated protocol to verify improvements.
Over time, this iterative approach ensures the protocol either:
- Meets best-practice standards, or
- Includes justified deviations that are documented and approved.
The ultimate goal: A robust, well-documented protocol that meets both operational needs and quality standards.
Getting Started - Your first pass through the workflow
This guide will walk you through the basic workflow to help you navigate your first protocol analysis. We recommend starting with a standard test protocol to get familiar with the process and outcomes. However, you can also use your own protocol if you prefer.
Workflow Overview
The analysis follows these key steps:
- Load the protocol and run an initial structure check.
- Review the protocol definition to prepare for the volume simulation.
- Run the volume simulation to model fluid behavior.
- Prepare for the cell simulation by verifying necessary parameters.
- Run the cell simulation to analyze cell behavior.
Step 1: Load the Protocol
- Click the Protocol Button.
- Select your protocol file. For detail: refer to Protocol Loading.
- If successful, the next step will become available.
- If an error occurs, refer to Protocol Loading Errors.
Step 2: Review Modify File Data
(This step is skipped by the application if no previous data has been saved.)
- Click the Modify Button.
- Review the modification settings.
- Adjust preferences or use Yes/No to All to continue.
- For more details, see Mod File Data Review.
Step 3: Initialize Volume Simulation
- Click the Volume Init Button.
- Adjust parameter settings or bag volumes if needed.
- Continue until you see this indicator:
- If adjustments don’t resolve the issue, see Volume Simulation Initiation.
Step 4: Run the Volume Simulation
- Press the Volume Sim Button to run the simulation.
- The system will display any detected guideline issues.
To Review Results:
- Select Kit View to see fluid and air distribution in the system.
- Select steps in the list to see the trigger decisions, fluid and air in the kit.
- Select List View to inspect bag fill volumes.
Reviewing Simulation Outcomes
- Guideline issues appear alongside the step list.
- Click on any step to review associated reports.
- Open the Information Tool for a summary report, which can be saved as a PDF.
- If the simulation fails, refer to Volume Simulation Troubleshooting.
Step 5: Initialize Cell Simulation
- Click the Cell Init Button.
- The system will review available data for the cell simulation.
- If adjustments are needed, see Cell Simulation Initiation.
Step 6: Run the Cell Simulation
Press the Cell Sim Button to start the simulation.
The button will change to:

Progress indicators and the kit schematic will update as the simulation runs.
Note: The simulation time varies depending on the number of cell types.
Step 7: Explore the Results
Analyze Cell Distribution
Open the Information Tool:
View the Cell Reconciliation Report to track cell distribution.Inspect Final Cell Positions:
- Go to the last step in the process.
- Open Kit View.
- Select each bag to see the composition of cells and media.
Visualize Fluid Dynamics
Run the Animation:
Select the Run Arrow to visualize fluid movement through the kit.Pause or Stop Animation:
Press Stop to halt the animation at any point. (There is no pause feature.)
Chamber Insights
- Open the Chamber View to examine:
- Cell Accumulation: Track how cells collect and separate in the chamber.
- Chamber Capacity: View a chart displaying the cell-retention potential under current conditions.
Step 8: Review and Adjust Parameters
Return to the Volume Init Screen to review suggestions for:
- Bag starting volumes.
- Parameter settings.
Click on any value to adjust it.
Reminder:
Any change here will automatically reset the Volume
and Cell simulations.
Next Steps
With your initial simulation complete, you can now:
- Investigate guideline reports and apply suggested mitigations.
- Generate PDF reports for documentation.
- Modify the protocol in the Rotea Protocol Builder.
- Re-run the analysis to confirm improvements.
Protocol loading
- The protocol file is never altered by the application.
- It is important your protocol file is located to a working area in your computer file system.
- The simulation will create a subdirectory at the protocol location to save the run log and report files.
- Select the 'Protocol' button at any time
The first time a protocol is loaded the 'Modify' is skipped since no changes have been saved
Once the protocol is loaded you can review, the operations in Kit view and any parameter settings in List View. Select a line in either view to observe the trigger and any repeat functions.
Protocol Loading options
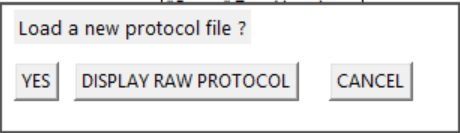
- Display raw Protocol returns the kit presentation to the 'pre-modify file' state so you re-visit the original protocol data and guideline report messages.
- Select the VOLUME INIT button or complete the MODIFY selection to return to the simulation.
Protocol description information
Press the 'information' tool
![]() when the protocol is loaded to review the description data from the
protocol.
when the protocol is loaded to review the description data from the
protocol.
- To avoid capture of potentially sensitive information, this information is only available when the protocol is first loaded.
- There is no facility to print it.
- To re-display this information at any time, press the Protocol button, and select 'No' to opening a new protocol.
Protocol Loading Errors
- Access privileges for the location of the protocol file need to be resolved, or a copy of the protocol file must be placed in a working directory
Selected File cannot be analysed
- There is likely some variation in the json file details of this file, potentially from an early release of the Rotea protocol builder.
- Verify you can open it with the Rotea Protocol Builder software and re-save it from that application. Then re-try opening it.
- If you cannot edit the file with the Rotea Protocol Builder, the application cannot interpret the file.
Protocol review errors:
![]()
- There are errors in the protocol recognised by the preliminary analysis.
- Normally a description of the error will be displayed.
- A common fault, for example, is failure to include a pause step for the final step.
- The information box will display a line highlighted with the error summary.
- The Guideline Reports tool is illuminated also.
- You can select the Guideline reports tool or double-click on the information box line to display the guideline commentary in the guideline report.
- If an error is raised, the guidelines are strongly recommending this issue should be corrected
- Managing error states
- It is recommended you Commit the guideline as a change activity. This will clear the error state and allow the analysis to continue.
- If the error is not valid for your process, you can Suppress the guideline for this step. Unlike 'commit', the hazard will no longer be accounted for this step.
- If you disagree with this guideline assessment, you can disable it, or change the alarm level, in the Guideline editor.
Modify File
This file holds settings you have previously used to analyse the protocol.
- It is created when you first make any changes.
- It is located in the working file directory.
- When you open a protocol, the application opens the mod file if it exists.
- The 'Modify' control is enabled if the file is found.
- Otherwise, default settings are drawn from the protocol and the 'Volume Init' control is enabled.
Protocol Changes
The working directory and modify file are linked to the filename of the protocol.
Any change to the protocol filename will create a new working directory independent of the previous protocol.
When a protocol is saved by the Rotea Protocol Builder, a timestamp is included.
If this application sees the timestamp has changed when opening the protocol, the guideline settings in the modify file are cleared.
Modify screen
The Modify screen shows any changes or additions to protocol-derived settings. These edits are saved in your Modify file and can be re-used next time you open the same protocol.
- You can choose to apply the new settings, or revert to the raw protocol-derived data.
- You can return to this screen at any time.
- Any change that affects starting conditions or parameters will clear existing simulation results (Volume + Cell) and require a re-run.
- Click the population labels to view population details.
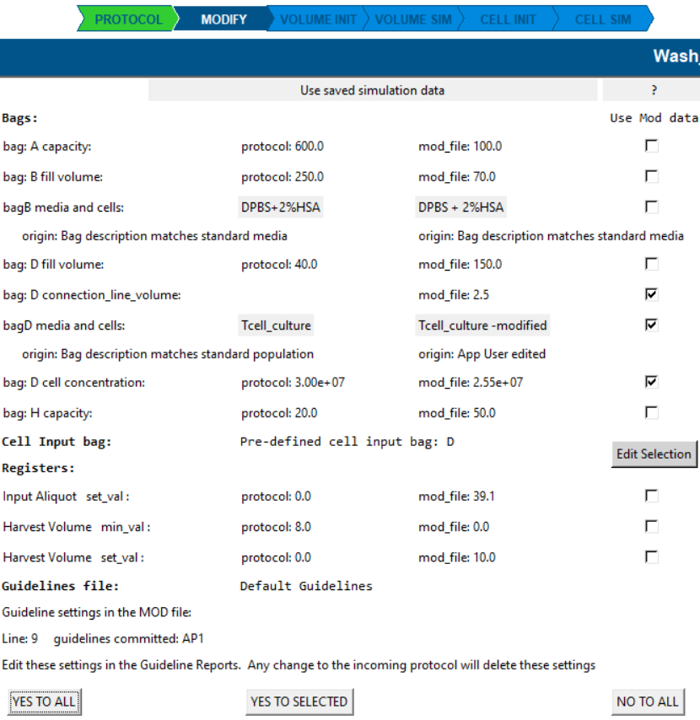
Applying changes
- NO TO ALL: continue analysis using raw protocol information.
- YES TO ALL / YES TO SELECTED: apply the selected changes to the protocol settings.
Once the Modify screen is completed, the Kit view reflects the selected changes.
This is a good time to refine any bag settings and cell population assumptions.
Refer to Expanded Bag Settings and Editing bag contents.
Cell input bag
This application needs to know which bag contains the primary starting population of cells/particles.
- If the protocol data already contains a recognised cell population, that bag is used automatically.
- Otherwise, you’ll be prompted to select the input bag.

Why the cell input bag matters
Knowing the cell input bag allows the application to interpret where priming stops and processing begins:
- Once processing begins, drawing from (or pushing into) untested fluid lines raises guideline warnings.
- Priming operations can be reviewed in isolation for completeness.
- After Volume Simulation completes, a priming summary is presented in the Information tool.
- Other bags may contain particles (e.g., magnetic beads), but the primary cell product bag is the focus here.
Working file directory
When a protocol is loaded, a local working directory is created to coordinate outputs (logs, Modify data, reports).
- The directory name is highlighted in the Information tool (select the i button).
- It comprises the first 6 letters of the protocol name plus a hexadecimal checksum of the full name.
- If you do not rename the protocol through editing, analysis outputs return to the same folder and the Modify file remains available.
Edit starting conditions
Once the Modify review is completed, the Kit view reflects any selected changes. This is where you refine:
- Bag contents (starting volumes, media, populations)
- Optional kit settings (line volumes, bag air volume, bag orientation, etc.)
All changes are saved to the Modify file for re-use.
Editing bag contents
Select a bag to view and edit its contents:
- To add cells or other particles, the bag starting volume must be > 0.
- To edit the cell population or media in the bag select
Edit.
ref: Editing bag contents
Additional kit definition details
After Modify review, optional kit settings become available to better inform simulation.
Select a bag in Kit view and choose Show More. Options vary depending on kit configuration.
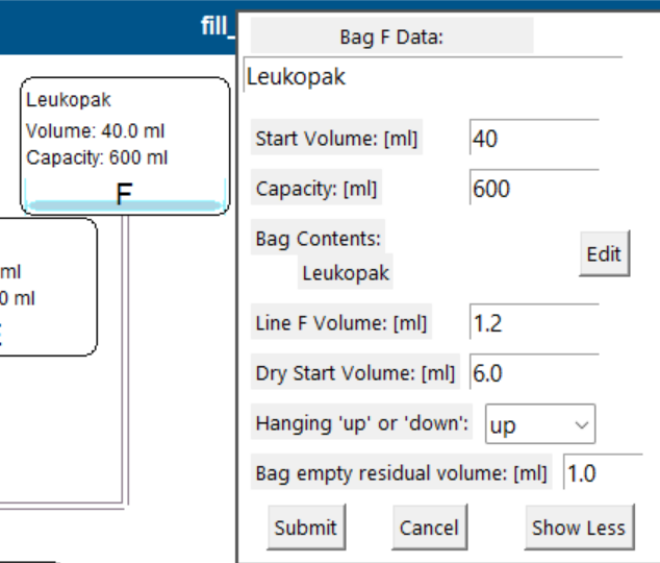

Line volume
- The fluid volume of the line connecting the bag to the kit.
- Not defined by the protocol; the simulation uses a default of 1.2 mL (≈150 mm of 1/8" or 3.3 mm tubing diameter).
- Line volumes affect priming volume needs and whether the bubble trap can support multi-step processing.
- If the kit includes a dual-port bag, the second line volume can be specified.
Dry start volume
Dry priming is one example of processing air only in the kit. The simulation tracks where air is located and monitors whether air is removed from processing regions.
- The goal is generally to remove all air from the processing zone.
- Air steps are possible with care.
- If you want to pass air through the chamber, centrifuge G must be < 10G.
- Dry Start Volume is the initial air volume in
the bag when attached to the kit.
- Default: 6 mL
- Extra air can be drawn without raising an alarm at this time.
Bag hanging up or down
Bag orientation can be used to model fill/finish scenarios using dry processing.
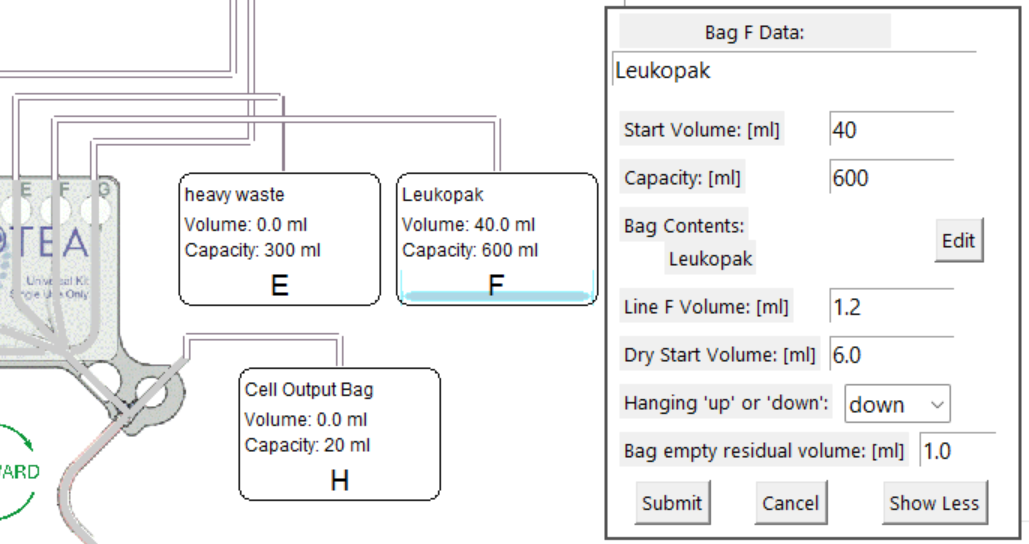
Hanging up mode (default): all fluid is drawn before any air is drawn.
Hanging down mode: all air is drawn before fluid is drawn.
Bag empty residual volume (not yet implemented)
Small-volume dispensing can leave a trapped residual film volume depending on bag material, size, viscosity, and temperature.
- This is not yet modelled, but will represent lost fluid volume (and lost cells).
- To minimise loss: consider rinse strategies or diluting final draw-down volume.
Initialise volume simulation
The Volume Simulation needs information that the protocol file does not contain. In this screen you provide:
- Starting bag volumes and capacities
- Run-time parameter settings (values that control volumes, timing, loop counts)
When these are defined well enough, the application enables the Volume Simulation.
Note: the simulation will still run with poor or incomplete settings — intentionally.
Seeing what fails (and why) can be useful when reviewing a protocol.
Editing rules of thumb
- Click directly on any editable field to change it.
- Editing bag volumes/capacity or any parameter setting will reset existing Volume Simulation results.
- Bag volumes can also be edited via Kit view by selecting the relevant bag.
Bag volume predictions
The tool shows:
- Bag starting volume and capacity
- Predicted minimum starting volume and maximum fill volume (grey block)
- Warnings where a bag is likely undersized (e.g., “Bag H capacity too low”)
You can edit bag capacity and starting volume by clicking values. Changes are stored in the Modify file.
Tip: adjust a loop volume parameter and watch predictions change — it’s a fast way to understand what drives reagent demand.
Protocol parameters
Rotea protocols may use parameters to control:
- Step timing
- Step fluid volumes
- Loop iteration counts
Protocol files can include parameter min/max ranges but do not store the run-time values.
How to edit parameters
- Click a Setting, Minimum, or Maximum value to edit it.
- A setting cannot exceed defined limits.
- If you need a value outside the range, adjust the min/max first.
Changing a setting clears existing volume simulation results.
Parameter applications and common hazards
Parameter selection can be non-intuitive. Poor choices can reduce
reliability at run time.
The application analyses how each parameter is used and flags common
hazards.
1) Final product volume (Harvest/Recovery steps)
Many users set harvest volume very low (e.g., 2.0 mL). But the kit and bag lines contain dead volume that must be budgeted or no product reaches the bag.
Rotea delivers the set volume past the output valve.
Before it reaches the output bag/vial it must pass through:
- tubing from the valve (example: ~0.2 mL)
- tubing to the output bag/vial (default: 1.2 mL)
If these volumes are not budgeted, output bag delivery can be far less than expected.
Guideline AV19 (Warning) triggers when no fluid reaches the output bag in a recovery step.
Volume Init estimates expected output bag volume including line-loss budgets.
2) Cell load volume (Multi-bite sequences)
Multi-bite protocols load product in repeated cycles:
- Load a parameter-controlled bite volume of cell product
- Wash cells retained in the chamber
- Recover to an output or intermediate bag
Loops commonly end when a bubble sensor detects the input bag is empty. Loop behaviour depends on:
- input bag starting volume
- bite volume setting (parameter)
Why the final bite matters
A low-volume last bite occurs if the draw-down setting is not well matched to bag volume, leaving only a few mL above the bubble sensor.
Low last bite volume can:
- disrupt bed formation, washing, and elutriation
- increase cell loss and dilute final product
- cause an extra loop cycle (more reagent use, more waste/output capacity demand)
Guideline AV8: monitoring final bite volume
Guideline AV8 checks the last bite as a percentage of the target bite volume.
- Typical threshold: 80%
- Typical upper limit: ~95% (to reduce the risk that small measurement errors trigger an extra loop)
- AV8 settings can be edited in the Guidelines Editor
Goal: choose a parameter setting that places the predicted last bite volume between the AV8 minimum and maximum.
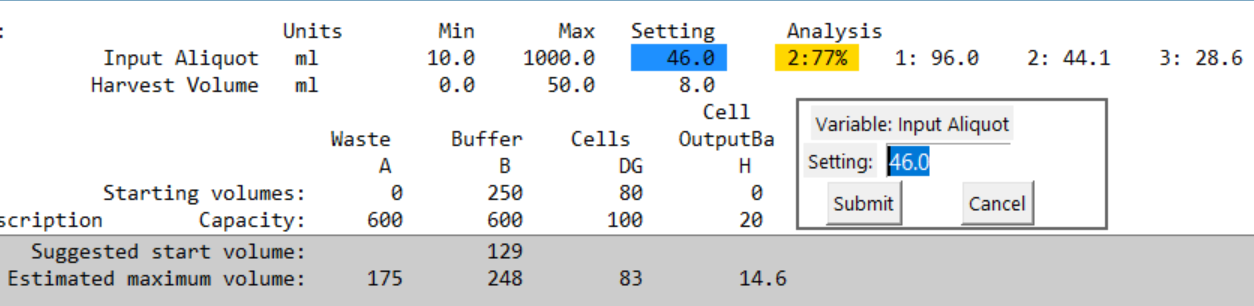
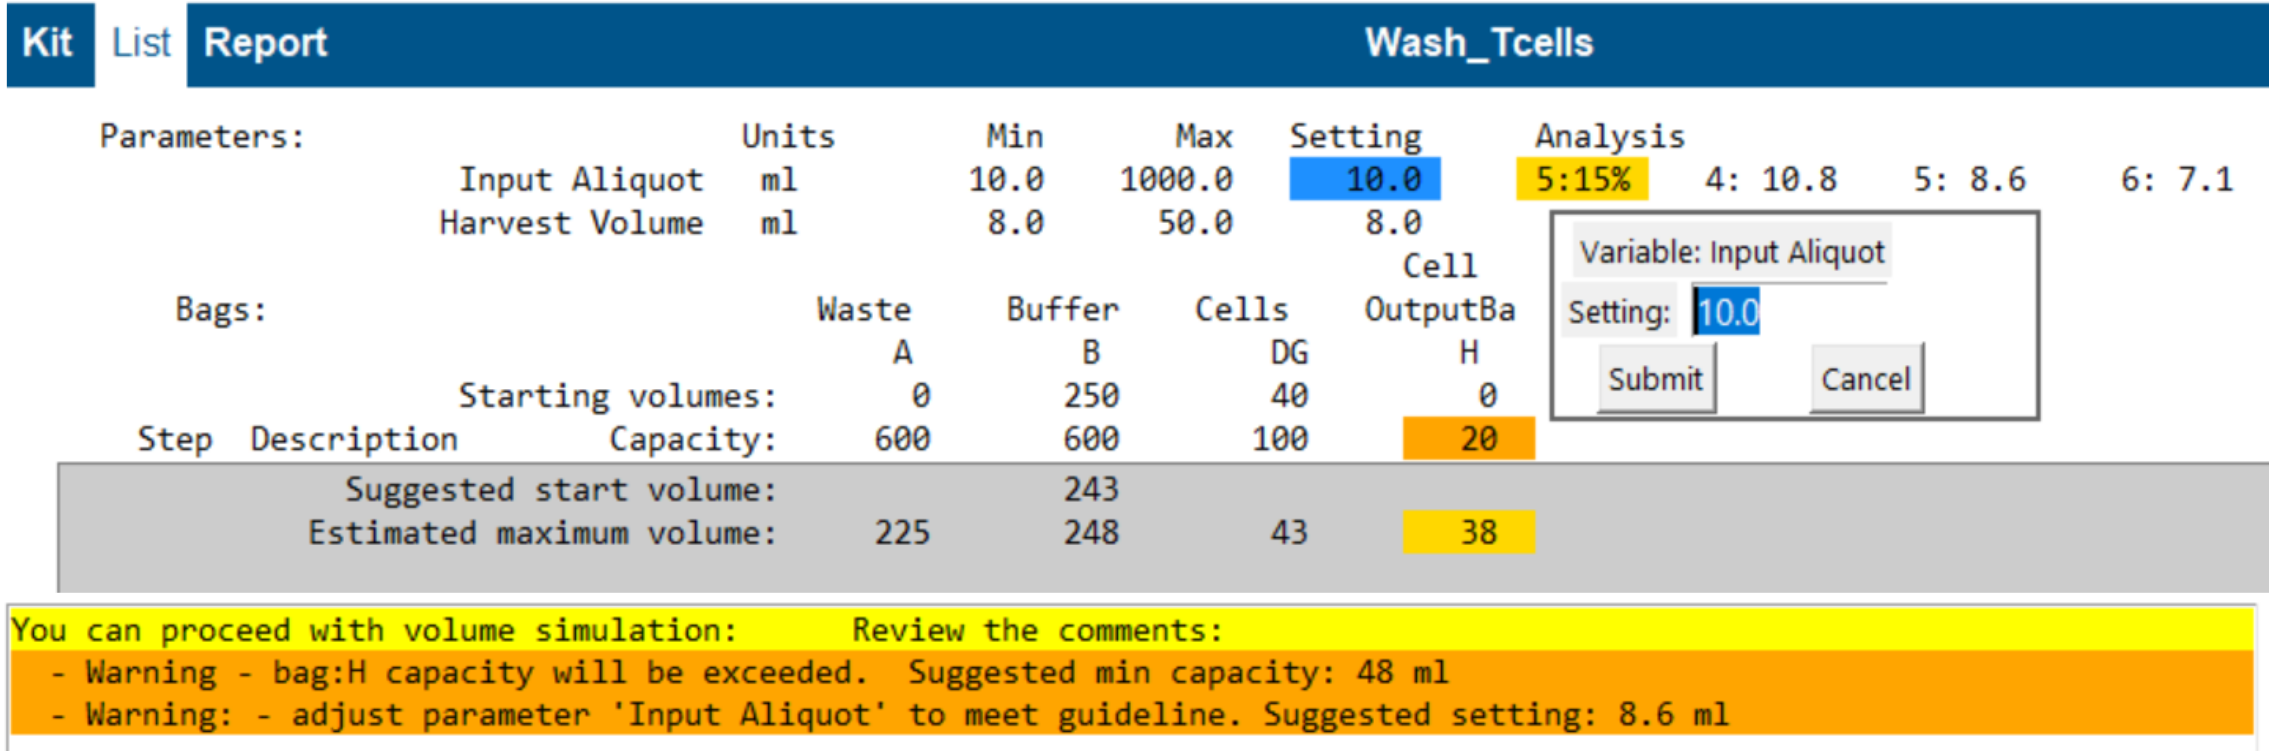
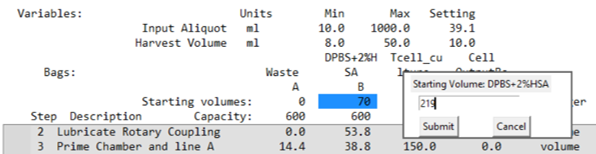
Example:
- Current setting for Input Aliquot: 46 mL
- Tool predicts 2 bites, final bite 77%
- Because 77% is outside AV8 (<80%), it’s highlighted
- Suggested settings appear to the right for different loop counts
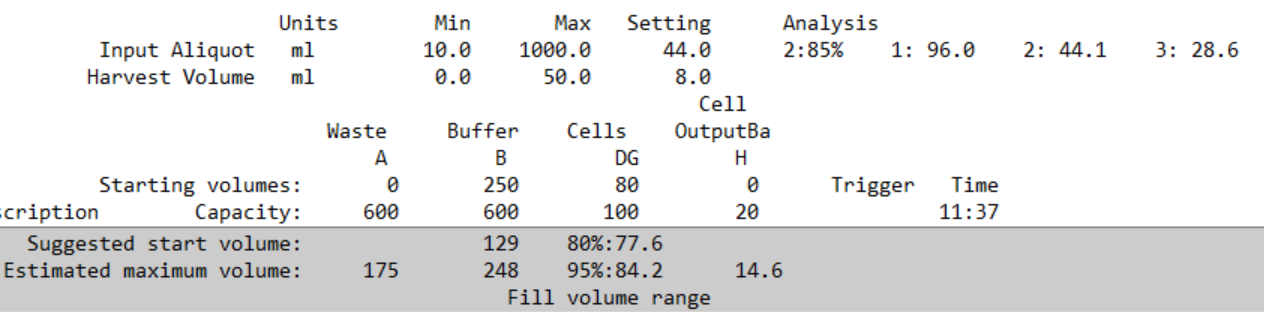
When within AV8 limits, a bag fill tolerance range is shown.
Example: an 80 mL input bag “works” if the actual measured volume lies between 77.6 and 84.2 mL.
3) Dilution volume (High cell concentrations)
Whole blood and leukopak inputs may require dilution to:
- reduce cells per bite (avoid chamber overflow)
- adjust media conditions for separation
Before simulation, Volume Init uses empirical checks:
- CL3 warns if chamber cell count is likely to overflow
- CL4 warns if loading concentration is too high for stable bed formation
During Cell Simulation, behaviour is monitored directly:
- CL1: concentration entering the chamber restricts bed formation
- CL2: retainable cells are being washed out due to lack of capacity
Special case: if dilution is also used as a
priming step and the dilution volume register is 0,
the input line may remain unprimed → air ingress risk.
Guideline AV26 warns if unprimed input lines are
detected.
Predictive tools
The Initialise Volume screen includes tools that estimate likely outcomes before running full simulation.
Predicting reagent volumes and bag capacity

The tool:
- predicts reagent consumption from protocol + settings
- estimates bag capacity requirements
- highlights insufficiencies
The simulation can run with insufficient volumes so you can observe failure modes.
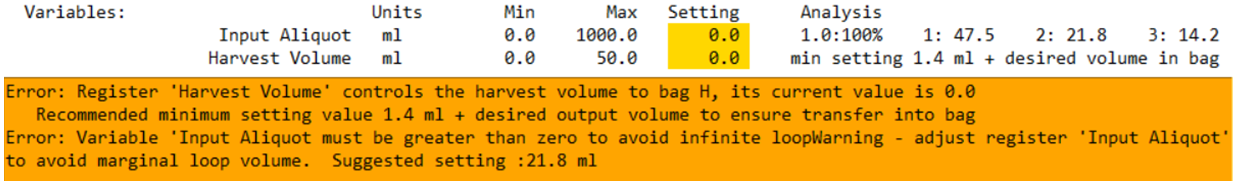
Detecting parameter hazards
Because protocol run-time parameter values are often missing at first review:
- values may effectively be 0
- this can create hazards (including potential infinite loops)
The application:
- sets parameters to their minimum on first open (which may still be 0)
- warns beside the parameter and in the information panel
- blocks simulation start if a true “infinite loop risk” is detected
- recommends minimums for harvest/recovery settings where applicable
Multi-bite parameter setting tool
This tool estimates the final bite volume in multi-bite loading steps and suggests parameter values that comply with Guideline AV8.

Example interpretation:
- Current parameter: 30.0 mL
- Predicted loops: 3
- Final bite: 67% → highlighted (below AV8 threshold)
- Suggested settings shown as loop count : parameter value (e.g., 4 : 20.9)

After updating the setting (e.g., to 28.2 mL):
- highlighting disappears
- estimate meets AV8 guideline limits
This prediction relies on an assumed input bag volume. When within AV8 limits, the tool shows a bag fill range (tolerance).
Input bag volume ranging
The product input bag typically arrives with variable starting
volumes.
The Starting Volume Slider lets you explore
sensitivity to input volume variation.
- move the slider to test different volumes
- predictions update in real time (reagent use, bag volumes, setting suggestions)
- slider changes reset simulations (volume/cell)

Slider buttons
By design, moving sliders does not automatically change saved settings.
- Reset Changes: restores original values
- Save Changed Settings: saves current settings to the Modify file
Tip: click slider min/max bounds to edit allowed ranges. Save them to reflect likely run-time bounds.
Cell concentration ranging
Multi-bite loading is often used to control cells per bite.
This tool explores the impact of changing input concentration.
- the concentration slider scales all input-bag cell concentrations proportionally
- predictions update in real time
- slider changes reset simulations
- save/reset behaves the same as the volume slider
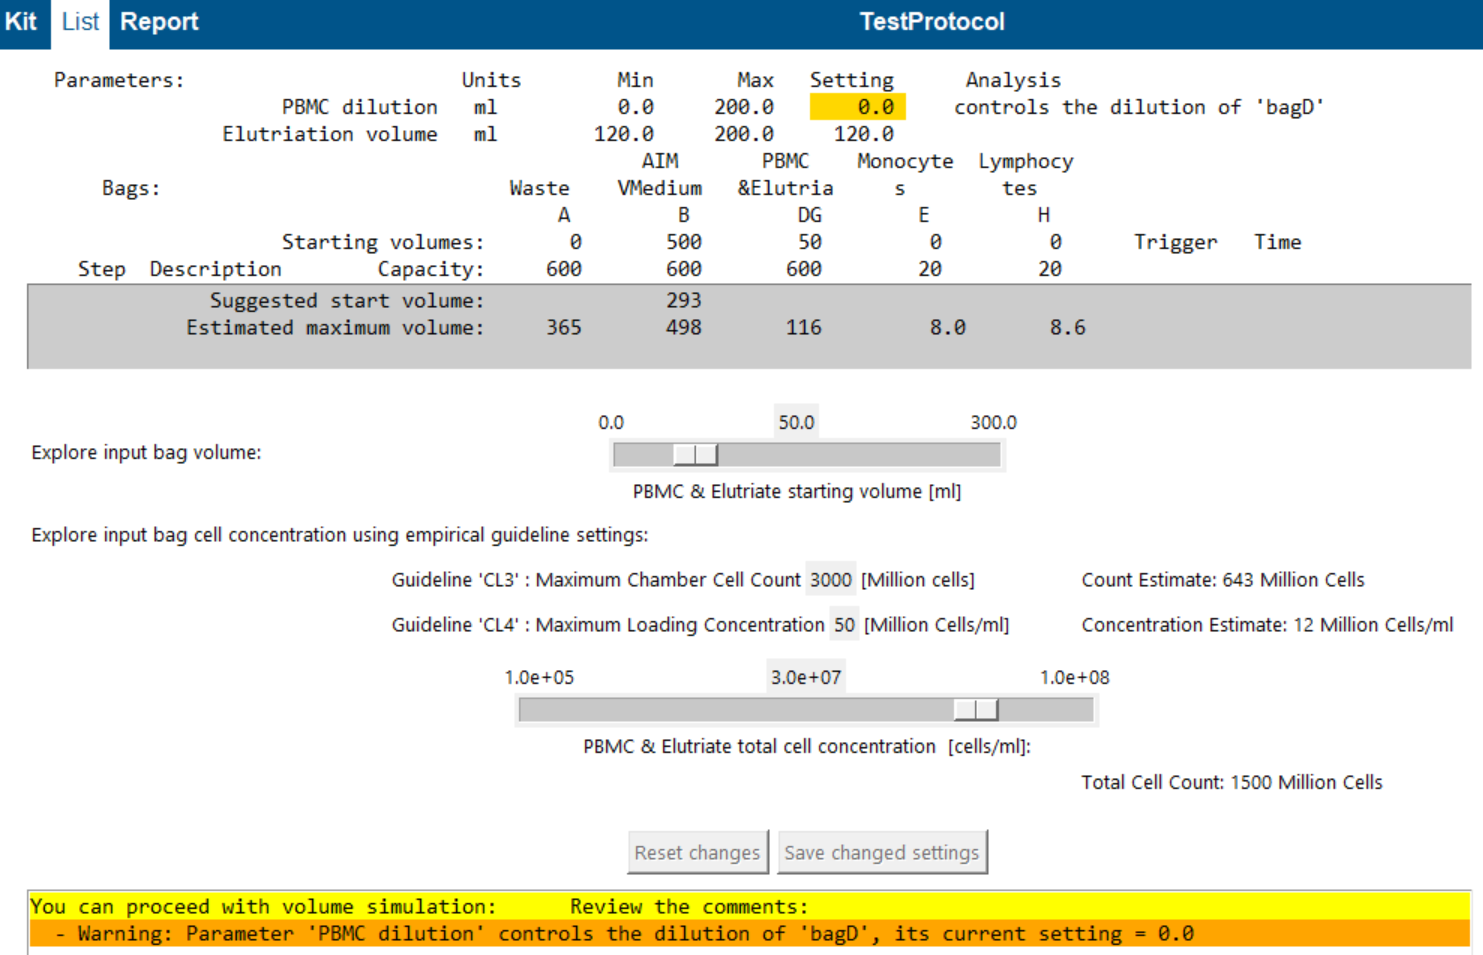
Empirical guideline settings (CL3 / CL4)
Because cell behaviour depends on many variables (cell type, media, G-force, pump speed), these are user-defined empirical limits:
- CL3: maximum chamber cell count (cells per bite)
- CL4: maximum loading concentration (cells/mL during loading)
As you change concentration:
- Count Estimate (cells per bite) updates (CL3)
- Concentration Estimate (cells/mL during loading) updates (CL4)
If limits are exceeded, suggested mitigations may include:
- reduce bite volume
- dilute input material (where protocol supports it)
Tip: set slider min/max to realistic run-time bounds, then explore safe bite and dilution ranges.
Volume Simulation
The volume simulator simulates fluid movement, identifies bubble sensor staus, and determines the triggers that control the end of each step.
It emulates loop controls to generate a sequence of steps based on the defined protocol.
The volume simulator estimates:
- The fluid volume transferred during each step.
- The time duration required to complete each step.
The List View displays:
- The fluid volumes in each bag.
- The trigger type and duration for each step.
Selecting a step reveals detailed information about its triggers and loop controls in the information box.
The volume simulation's primary goal is to mimic process conditions for guideline analysis.
Guideline Deviation Display
Guideline alerts are highlighted as color-coded text symbols to the left of the step list:
- A - Advice
- W - Warning
- E - Error
- C - Committed for change
To review these reports:
- Switch to Kit View and select any step with highlighted symbols.
- The information box will display a color-coded summary of the associated guideline reports.
- Double-click any line to open a detailed view of the corresponding guideline report.
Tip: For more information, see the Guideline Reports section.
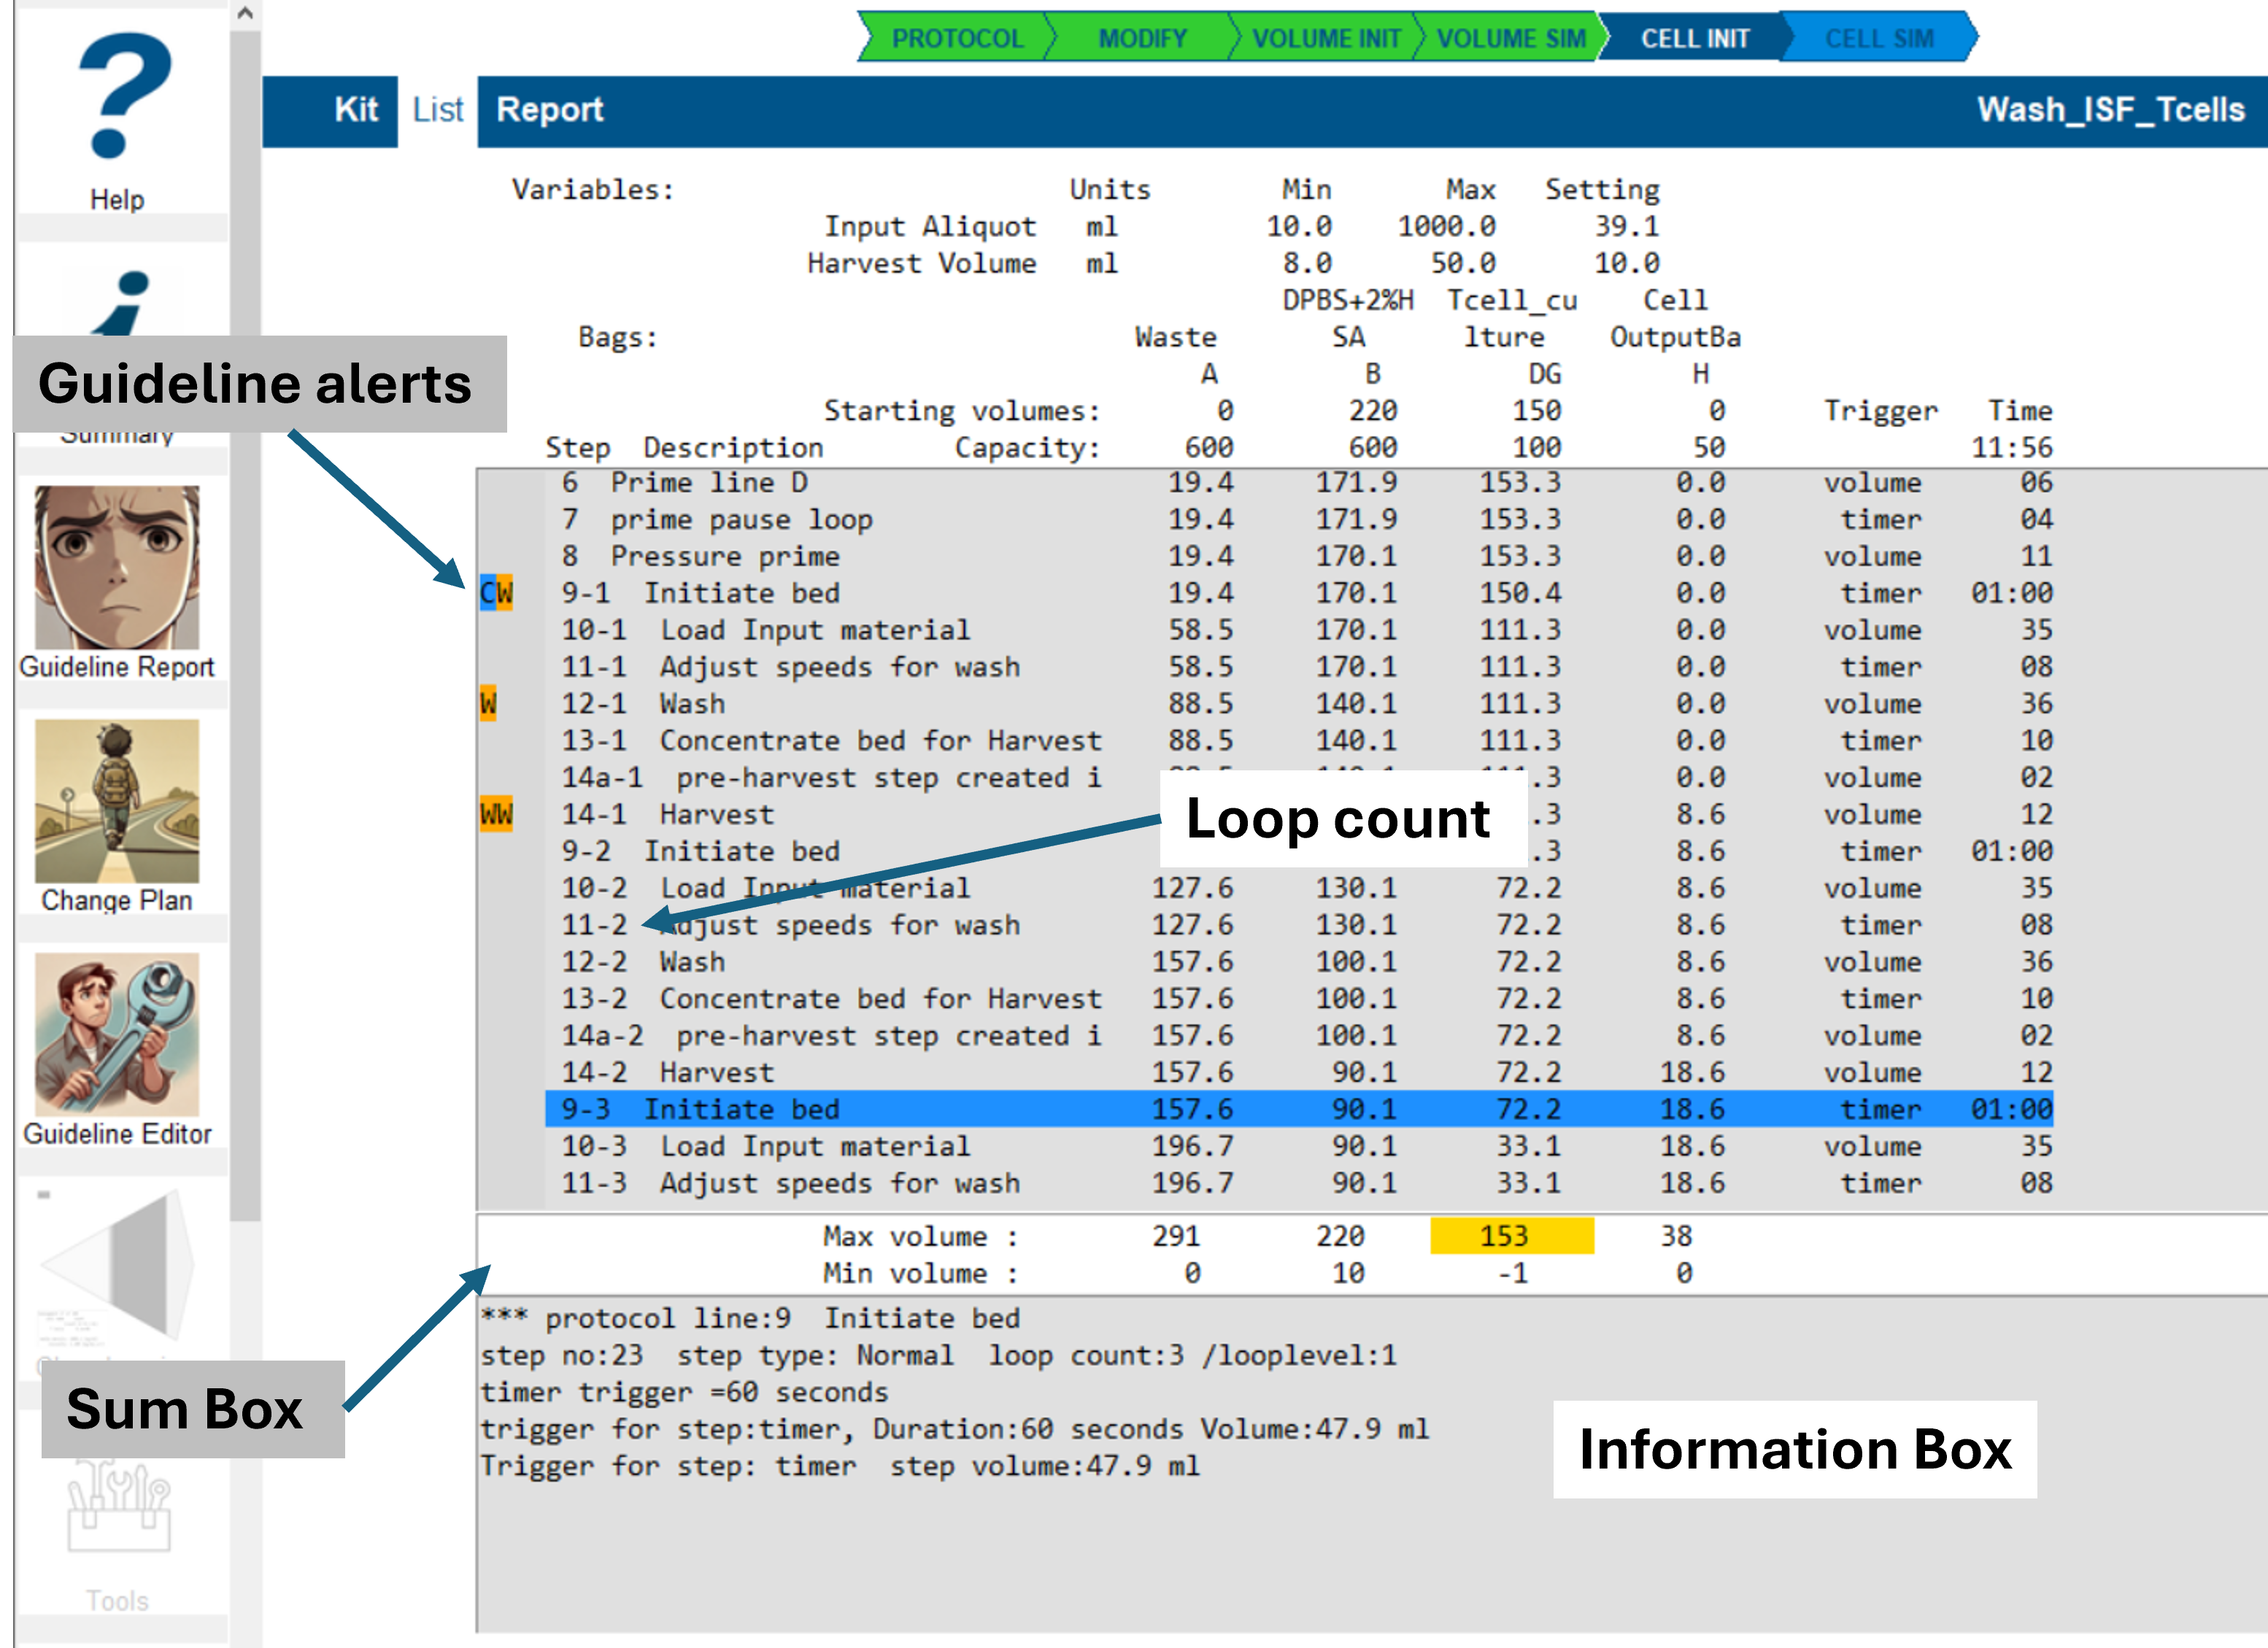
Volume Simulation Results
The image above shows a typical volume simulation result for a protocol with a single active loop.
The blue-highlighted line indicates the selected step, which was chosen by clicking on it.
Information Displayed in Each Line
- Guideline Alerts: Displayed if any guideline issues are detected.
- Protocol Line Number and Loop Count: Displays
the protocol line number and loop
count.
(Nested loops may display multiple loop counts.) - Step Description: A brief summary of the step's operation.
- Bag Volumes: The fluid volume in each bag at the end of the step.
- Trigger Type: The trigger type
that determined the step's volume.
- This information is displayed in the information box and can also be inferred from step-to-step volume changes.
- Step Duration: The step's duration in HH:MM:SS format (Hours:Minutes:Seconds).
Information Box Details
The information box displays additional step-specific information, which is also stored in the log file in the working directory.
Displayed Information Includes:
- Protocol Line Number and Description:
- Identifies the protocol line being executed.
- Step Number, Step Type, and Loop Level
Tracking:
- Protocol lines may be repeated multiple times within loops.
- Step numbers indicate the execution sequence within the protocol.
- The step type is defined in the protocol configuration.
- Harvest Step Adjustment:
- For harvest steps, the simulation inserts a pre-harvest step to simplify process logic.
- Step Triggers:
- Multiple triggers can be associated with a step.
- The Trigger for Step field shows the trigger type and final trigger volume for the step.
Understanding Negative Volumes
When fluid is drawn from a bag, the Rotea system determines when the bag is empty by monitoring a bubble sensor.
Bubble sensors are positioned at the end of the fluid line connecting the bag to the kit.
As a result, the bag volume may be drawn down below zero representing the fluid in the connecting line.
- In some cases, it may be necessary to retrieve the remaining fluid from the kit to the bubble sensor.
- To achieve this, a controlled 'draw-down' step may be used to move fluid past the bubble sensor.
- As a result, the bag volume becomes
even more negative.
- This action will trigger a guideline error; however, since it is intentional, the guideline can be disabled for this step.
The volume simulation intentionally allows these negative values to emerge and propagate through the simulation.
Guidelines continuously monitor the process and raise warnings or errors if potential issues are detected.
Troubleshooting Failed Volume Simulations
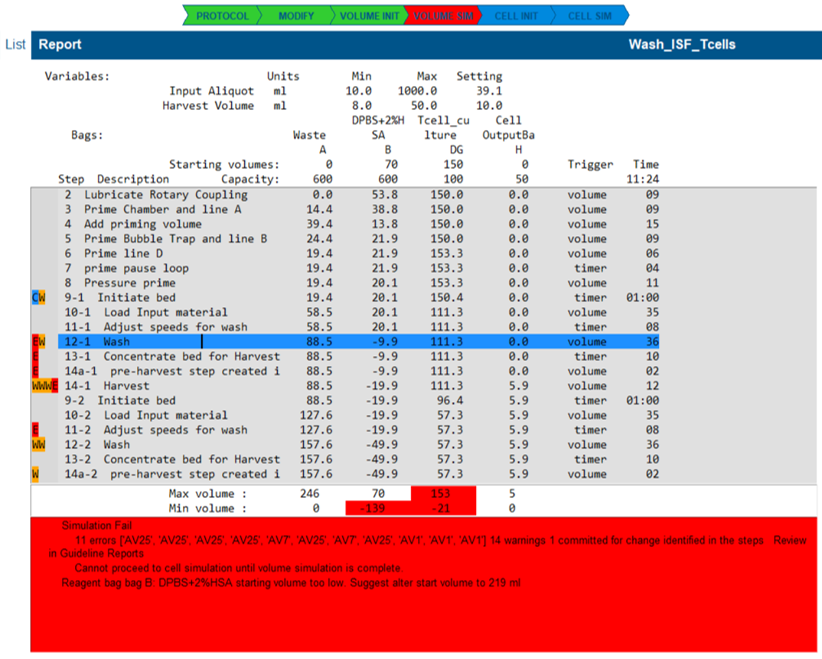
A volume simulation will fail if one or more guidelines raise an error condition.
- the illustrated state highlights many guideline errors that have occurred because the reagent ran out.
Check for Reagent Shortages
- Open the List View and check the summary box for a reagent shortage message.
- The example report indicates Bag B is too low and suggests a new starting volume.
- If a shortage is detected:
- Adjust the bag start volume by clicking the value setting and entering a new amount.
- Re-run the simulation by clicking the Volume Sim button.
Review Guideline Alerts
- Look to the left of the step listing for colored guideline indicators.
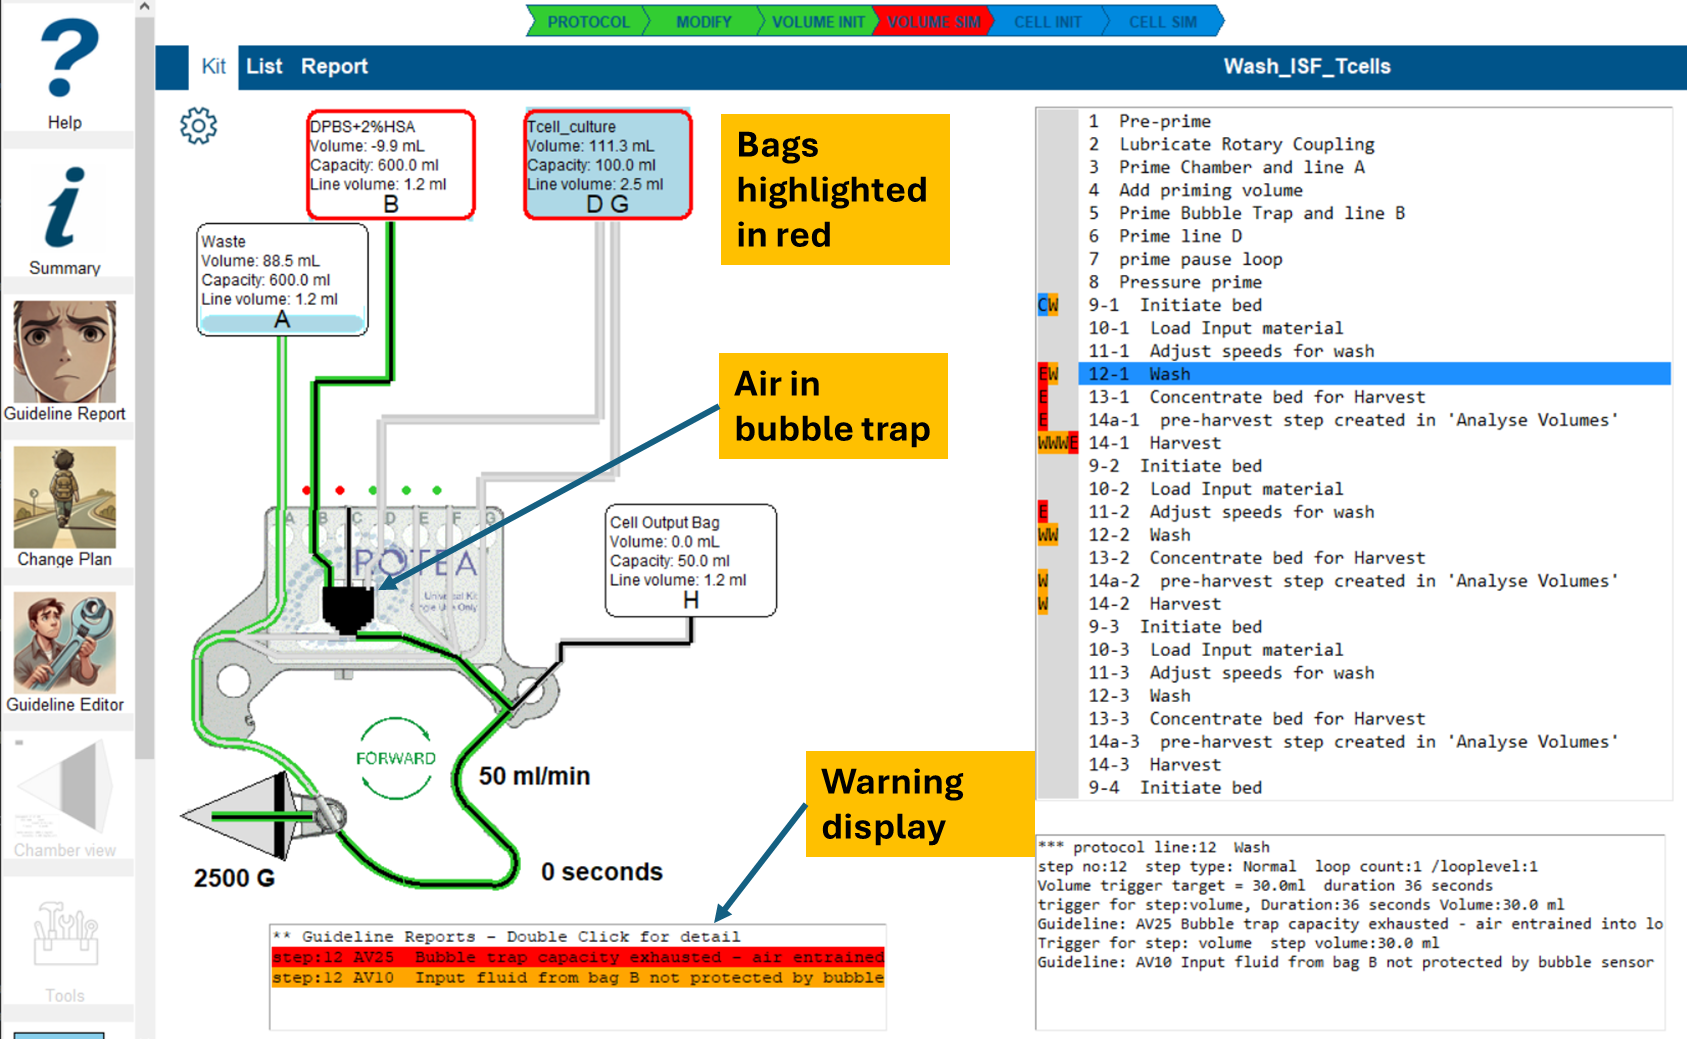
- Identify the first step with a red error indicator.
- Switch to Kit View. (Refer to image below)
- The warning display, displays a summary line for each guideline alert of the selected line.
To investigate further:
- Double-click the guideline summary line to open the [detailed guideline report](#Reviewing guideline conflicts in your protocol).
To resolve the issue:
- Select 'Commit' to add the recommendation to the protocol change plan.
- Select 'Suppress' if you are sure this guideline is not valid for this step of your protocol.
- Save the changes to apply the selected action.
- Return to the Volume Init screen.
- Re-run the volume simulation to verify if the issue has been resolved.
Kit view in volume simulation error state
This view also highlights visualization of the air in the kit, (shown in black,) at the end of the step.
Cell Simulation Initiation 'Cell Init'
The protocol settings and bag contents are reviewed to check if there is sufficient information to proceed with the cell simulation.
- All bags with a starting volume >0 must have media defined.
- For a cell simulation, the 'cell input bag' must have a
particle/cell population defined.
- Other bags can have particles present also.
- Missing information is highlighted in Kit view with the offending bags in red.
- The bag population data can be edited from this point.
Bag contents can be edited in Kit view after the 'Modify' options have been selected.
All changes to bag contents are saved in the Mod file for re-use.
- A message will advise when the cell simulation can proceed.
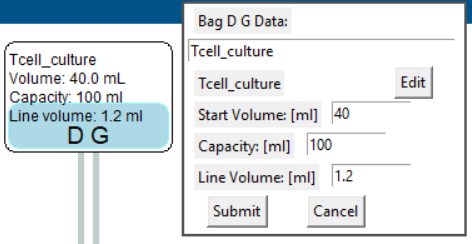
Editing bag volume data
- In Kit view select the bag to be edited.
- The top window displays the label, starting volume, bag capacity and line volume for direct editing.
- Any change to the volume settings will reset the volume simulation.
Editing bag population data
- In Kit view select the bag to be edited.
- If the bag starting volume >0:
- Below the label is the description of the bag contents that can be edited at this time.
- The 'Edit' button displayed to the right of the bag population descriptive label.
- Select the edit button to display the existing population data for the bag.

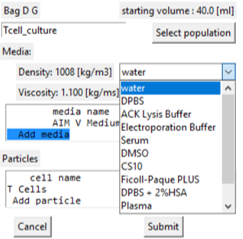
Using standard populations
- A description of the population is displayed at the top with a
'Select Population' button
This allows the entire population to be created from a standard group.
The bag population selected this way can be edited in detail, independent of the standard group.
Pick on the drop-down box to display and select from the available standard groups.
The bag population is now displayed with the standard group details.
Press 'Submit' to confirm the editing process and return to the kit view.
It is not required that a standard population be selected. Reagent bags for example do not require a particle population.
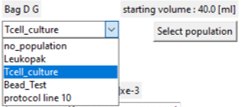
Note the 'protocol line 10' entry in the list. This refers to a population found in the protocol builder process simulator for line 10.
Defining or editing the media in the bag
- When the bag population data is displayed the 'Media' section displays a summary of the existing bulk density and viscosity.
- The box below displays any media description and the percentage contribution to the total volume.
- An 'Add media' line is also displayed.

Edit media item
- Select the media item from the list in the display box
- A window allowing you to edit details of the media is displayed.
- If more than one media is in the population a 'Delete' button is available to remove this item.
- Change the description and properties as you wish.
- Set the 'Percent' item to your target for the media.
- When the changes are submitted, the percentage of any other media components will be adjusted to honour this value.
- Submit changes returns to the population display window but changes are not locked in until the population window is 'Submitted'
Adding media to the population
- By adding media we are changing the components in the media - not changing the volume.
- Select the 'Add media' line in the display box.
- A drop-down box of the stored standard media types is displayed for selection.
- If selected the media edit window is displayed.
- The Percent of this media in the final volume needs to be entered.
- Default value is to be equi-proportional to the other media types.
- The media description and properties can be edited at this time.
- Submit changes returns to the population display window but changes are not locked in until the population window is 'Submitted'
Defining or editing the cells / particles in the bag
- When the bag population data is displayed the 'Particles' section displays a summary of the existing particle population.
- For each existing cell type, based on the starting volume for
the bag, (top right of population window,):
- the cell count is displayed based on the cell concentration.
- the percent of the total population count is displayed.
- An 'Add particle' line is also displayed.
Adding cells / particles to the population
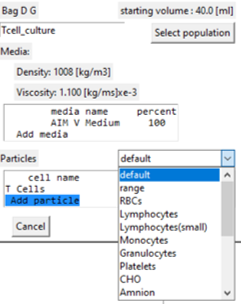
- Select the 'Add particle' line in the display box.
- A drop-down box of the stored cell / particle types is displayed for selection.
- If selected the particle edit window is displayed.
- The immediate focus is to specify the cell concentration that is 0 by default.
- The description and properties can be edited at this time, Refer to Particle Properties for more detail.
- Submit changes returns to the population display window but changes are not locked in until the population window is 'Submitted'
Edit cell / particle item
Select the cell item from the list in the display box
A window allowing you to edit details of the cell type is displayed.
A 'Delete' button is available to remove this item from the population.
Change the description and properties as you wish. Refer to Particle Properties for more detail.
The 'Concentration' entry is specific to this use of the cell type.
The Colour button can be used to set a visualisation colour for the cell type.
- The colour and visibility of each cell type can be set dynamically using the Kit Settings window.
Submit changes returns to the population display window but changes are not locked in until the population window is 'Submitted'.

Particle Properties
Description You may apply any text description you choose.
Concentration: units 'cells/ml' using scientific notation: 1 million cells/ml = 1.e6, 150 million cells/ml = 1.5e8
Cell Density: units 'kg/m3' = 'grams/liter' A Minimum and Maximum value can be specified to reflect normal variation
Cell Diameter: units 'micron' A minimum and maximum diameter can be specified.
Compensation Factor: Ratio = 1.0 +/- 0.2 say to direct the particle behaviour in the model to reflect your experience:
- more than 1 makes the cell relatively heavier more reluctant to elutriate.
- less than 1 makes the cell lighter and more inclined to elutriate.
- Red blood cells seem to behave more realistically with a compensation factor = 0.8 for example.
Colour Pick any color :-) from the colour chart. Note the selected color is altered by cell concentration.
Particle Size Distribution Select the histogram image to review the particle size distribution.
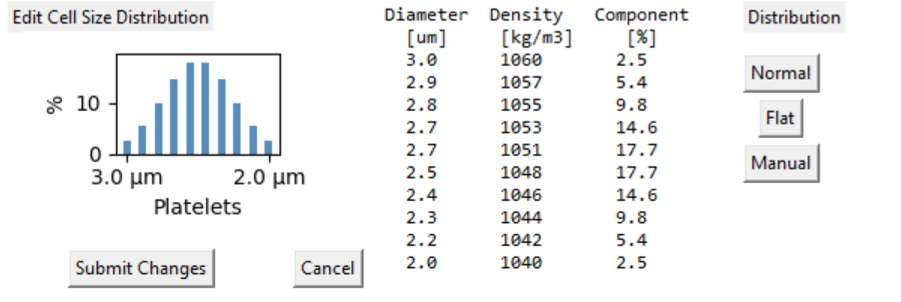
Particle Size distribution
- Cells exist as a population of shape, size and density.
- Some cell 'types' may comprise multiple subtypes with overlapping distributions.
- The simulation enables multiple overlapping cell types to be defined and to explore how they might be isolated from each other. example
- Counterflow centrifugation can provide outstanding selectivity of cells, enabling preferential selection of wanted cells and selective removal of other cells - for example removing dead cells to increase populaiton viability.
- The differentiation between cells in the centrifuge chamber is by [delta row x D^3]. That is the density difference between the cell and media, and the cube of the cell diameter, (assumed as a sphere.)
- (Note for the querulous: The cube of diameter comes from the differential buoyancy - not Stokes drag.)
- Since cells present as a distribution, the simulation represents an individual cell type as a distribution of 10 particles.
- The 10 bins are distributed across the (density * diameter^3) range. The largest diameter cells are on the left.
- The individual 'bins' of cells can be separated from the other cells. Separation of overlapping cell types can be observed.
- For more fidelity, you can create multiple cell subtypes to reflect a complex population.
- Physical measurements suggest many cells are represented by a Normal distribution which is the default.
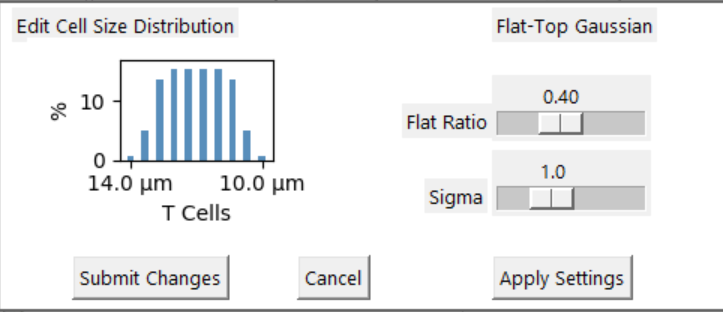
- The Flat distribution is useful to explore the effects of CF ratio changes on the process outcomes.
- The table displays the diameter and density for with each 'bin' in the distribution.
- Manual provides additional distribution definition tools.
- The cell distribution is saved in the 'Modify' file with the population data**
- Whenever a cell type is displayed you can select it to display the 'histogram' of its components
- Further illustration of the cell interactions can be seen in chamber view
Cell simulation
The purpose is to explore how the cells move around the kit in response to the process.
Creating the opportunity to recognise unexpected outcomes from the protocol.
Highlighting guidelines that rely on cell population calculation to be assessed.
- For example, how do we know if we are trying to put too many cells in the chamber?
Predicting the protocol performance in terms of yield.
Identifying where we might be losing cells systematically for want of minor protocol changes.
It is important to recognise this simulation of cells in the
bags, kit and chamber is intended to highlight how the protocol
effects the movement of cells rather than any absolute
representative model.
The user must test with real cells to verify for themselves
how representative the model is.
As a simple guide it is useful to know:
- The simulation proceeds incrementing in 0.1ml increments.
- The small volume of cells and media move through kit tubing without interacting.
- When cells and media enter a bag, the media is mixed with the bulk of the bag and cells are dispersed into the bag cell population.
- When cells are drawn from a bag, the mixed media and cell population of the bag are supplied
When the pump is flowing in the forward direction:
- The chamber is analysed as 100 segments where the cell
capture/elutriate state is calculated for each cell (at that pump
and centrifuge setting)
Each segment is calculated to estimate if the cells:
- will be held in the segment,
- overflow to the next segment or
- settle to the previous segment.
Different cell types interact in the chamber on the basis of a 'combined histogram'.
- The 'histograms' of all cell types are merged into a single histogram, ordered on the basis of cell density x diameter cubed.
- This means larger and denser cells will occupy the chamber squeezing smaller cells further up the chamber.
Media flowing into the chamber passes through the chamber without mixing.
- The cell capacity calculation for each segment of the chamber may change as it flows through.
When the fluid flow through the chamber is reversed, the zones in the chamber containing cells and media are simply reversed out.
These interactions can be visualised once the cell simulation has completed.
Running the simulation
Once the volume simulation is complete, check the information is available to complete the cell simulation by pressing the cell Init button on the WorkFlow bar.
- This will advise of any missing information needed such as bag media and cell population data.
With cell init complete press the Cell Sim arrow. The arrow will be orange to highlight it is in progress. The process can take some time: up to minutes. The duration clock illustrates progress.
When complete, the final step will be highlighted Green as will the 'Cell Sim' arrow.
The Kit View is presented in a different format and a range of visualisations are available.

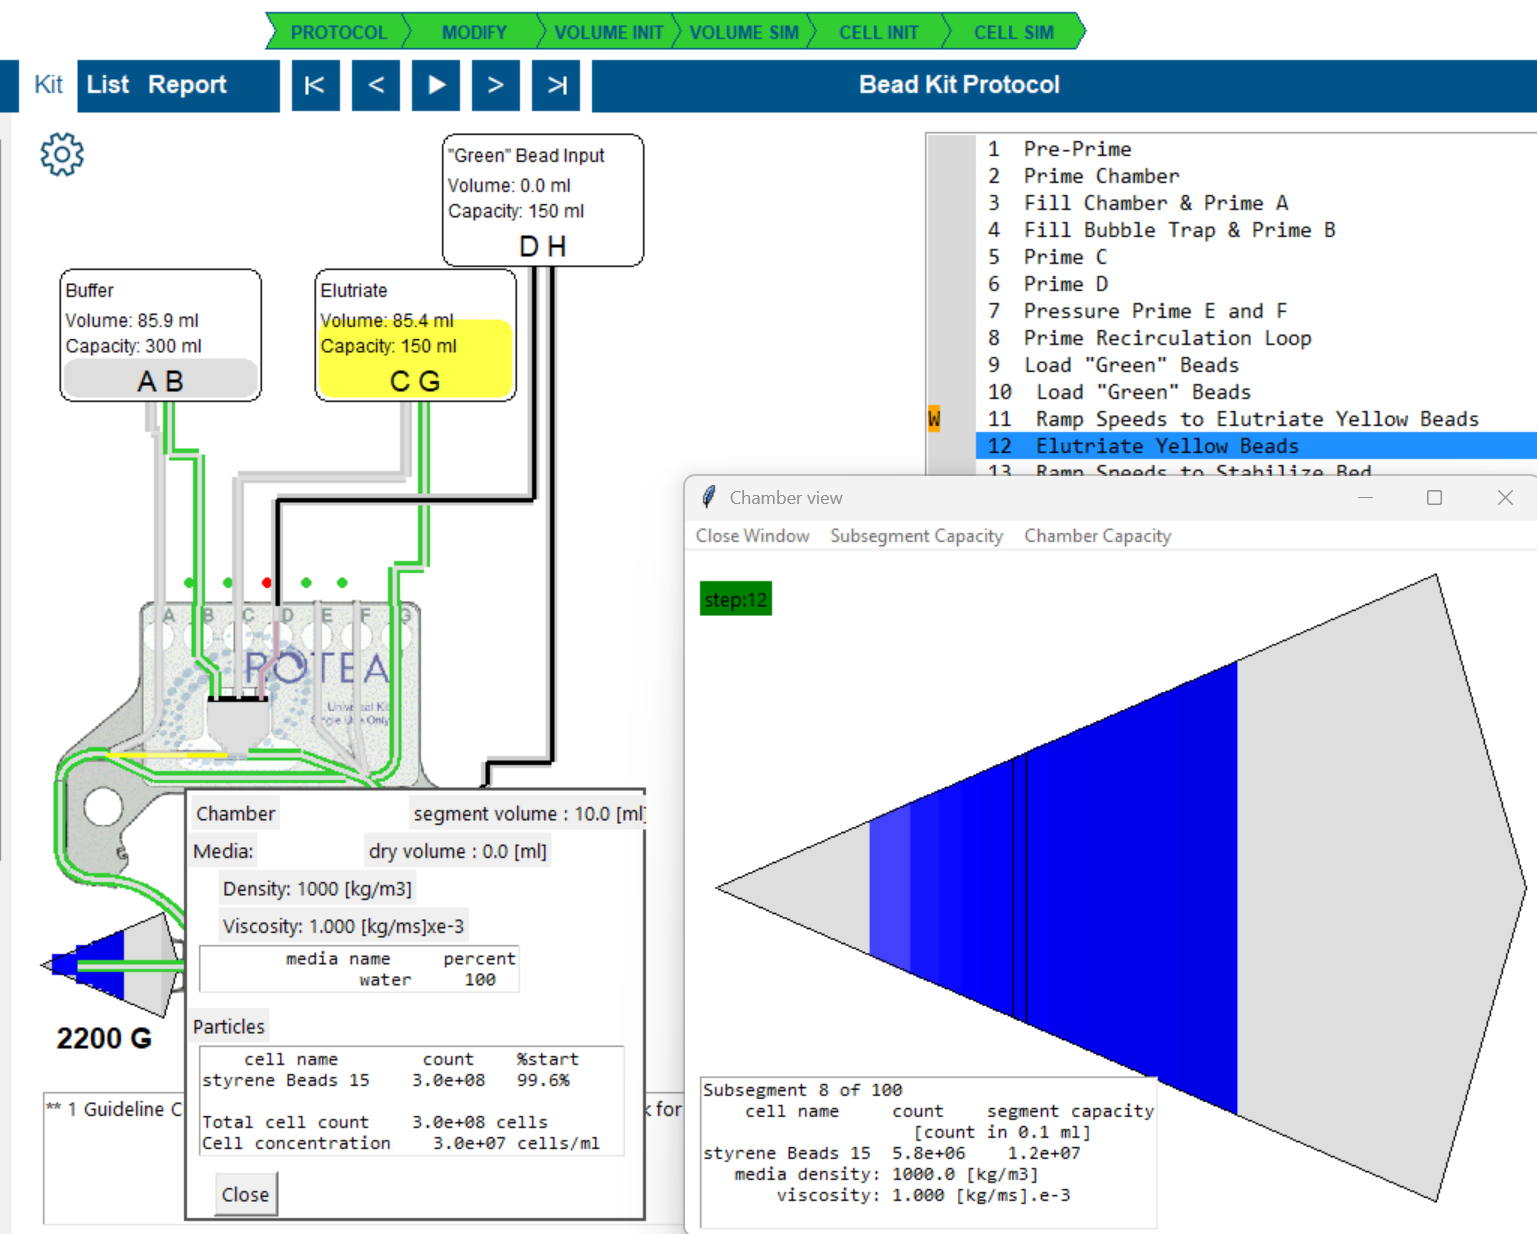
- This image shows the cell simulation complete. The lines in the kit, the chamber and the bubble trap display the current population.
- The bag images also display the bag volume and cell population.
- Black lines show where air is in the kit or bag lines.
- In this case, the grey color indicates there is media in the lines and bubble trap.
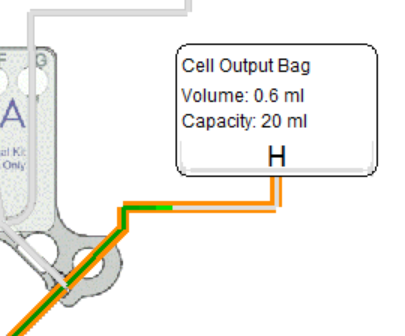
- The only bag with cells and a not-grey color is bag H. Clicking on Bag H displays the contents information.
- It shows we have changed the media to 98% wash media, and retrieved 100% of the cells in a volume of 38.6 ml. That is a good result.
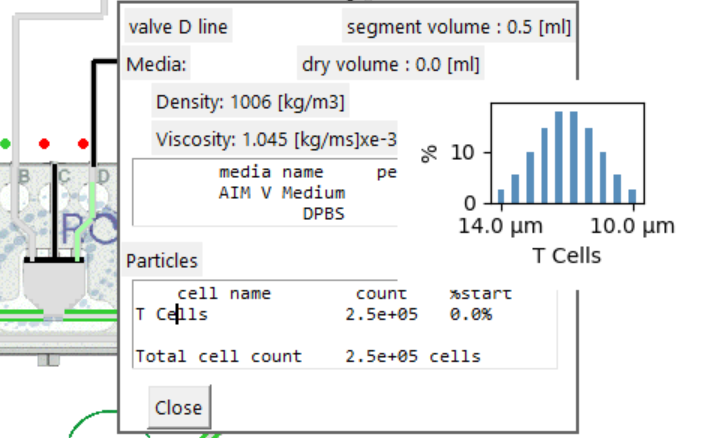
- Observe the pink kit line for valve D, this is the input line for the cells.
- If you click on the kit line, the contents of that kit feature
will be displayed.
- In this case a vanishingly small number of cells.
- If you click on any cell type in the 'Particles' list, the
histogram of cell components is displayed.
- In this case it is the originating distribution. Explore when cells are washed out of the chamber.
By selecting other steps in the protocol you can see where the cells have moved after each step.

Kit View Settings
The settings tab in kit view opens a window for setting visibility and colours.
Toggle active kit highlight: Changes the kit view to shadow in-active bags and lines for each step - try it.
Media only colour: Allows you to select a color contrasting between wet with media and cell populations.
Dry Fluid (Air) colour: Allow you to select a color highlighting dry segments in the kit.
For each cell type in the population:
- Hide / Show button: displays the cell type or not - allowing you to track one cell type for example.
- Colour button: Alter the base color for the cell type
Color Intensity of the display for all cells can be altered with the slider.
Animated simulation
Once the cell simulation is complete, you can view the animated movement of cells through the kit.
Pick a line in the list of lines and press the play button.
You can press stop at any time during the simulation to view the status in detail.
Clicking on any of the kit lines, bag lines, bags, chamber or bubble trap will display the fluid volume and contents of that feature at the time you stopped the simulation.
Pressing Run again will re-run the same step from the start.
You can observe:
- the movement of the fluid through the kit.
- Air is displayed as black by default so early steps in the protocol highlight the priming actions.
- The fluid flow lines, bag contents and chamber contents are coloured according to the cell population.
- The cell groups to display and colour choices can be altered in the kit view settings.
Chamber View
Once cell simulation is complete, the chamber view tool is
enabled
 in the left-hand toolbar.

- Pick a line in the list of lines where cells are loaded or washed in the chamber.
- The chamber state displayed is the state at the end of the step.
- Press the run button to observe the changes of cell population in the chamber through the step.
- You can press stop at any time during the step simulation to view the state at that time. (There is no pause, you have to start from the beginning of the step each time)
Chamber sub-segment population
Select a region inside the displayed chamber; the cell population is displayed.
- In this example cells are being loaded into the chamber.
- There is a concentration of T-cells and B-cells in the segment.
- These cells are washing through to a point in the chamber where they might be retained/accumulated,or they may be elutriated out if the media and chamber speed and flow rate does not support their retention.
- Granulocytes have accumulated in this subsegment but the incoming stream continues to supply Granulocytes, so any cells beyond the capacity for the segment will be elutriated through to the next segment.
- The NK cells and RBC's have 'No cap calcd' indicating the current chamber speed and flow rate will not support their retention.
Chamber Capacity plot
Press the 'Chamber Capacity' tab to plot the potential chamber retention for each cell type.

- The capacity plot highlights the location in the chamber where cells can begin to accumulate based on the centrifuge speed, pump speed and media.
- Note how some cells cannot accumulate until well into the
chamber under these conditions: media, centrifuge and pump speed.
- It does reflect observations from early bed building process development.
- Be aware these capacity estimates relate to a single cell species. Each capacity line assumes there are no other cells in the system.
Total chamber contents
- Click on the chamber image in Kit view.
- The total cell population in the chamber is displayed.
- In this example a larger aliquot of the Leukopak is being been drawn in.
- The Tcell population is quoted at 100.4% reflecting the overwhelming of the chamber capacity for this cell type.
- Tcells are being lost to waste during the loading step.
- Click on Bag A to view the cells lost to Waste so far.
The simulation emulates speed ramping so intermediate points in the step can display different chamber capacity.
Subsegment population display
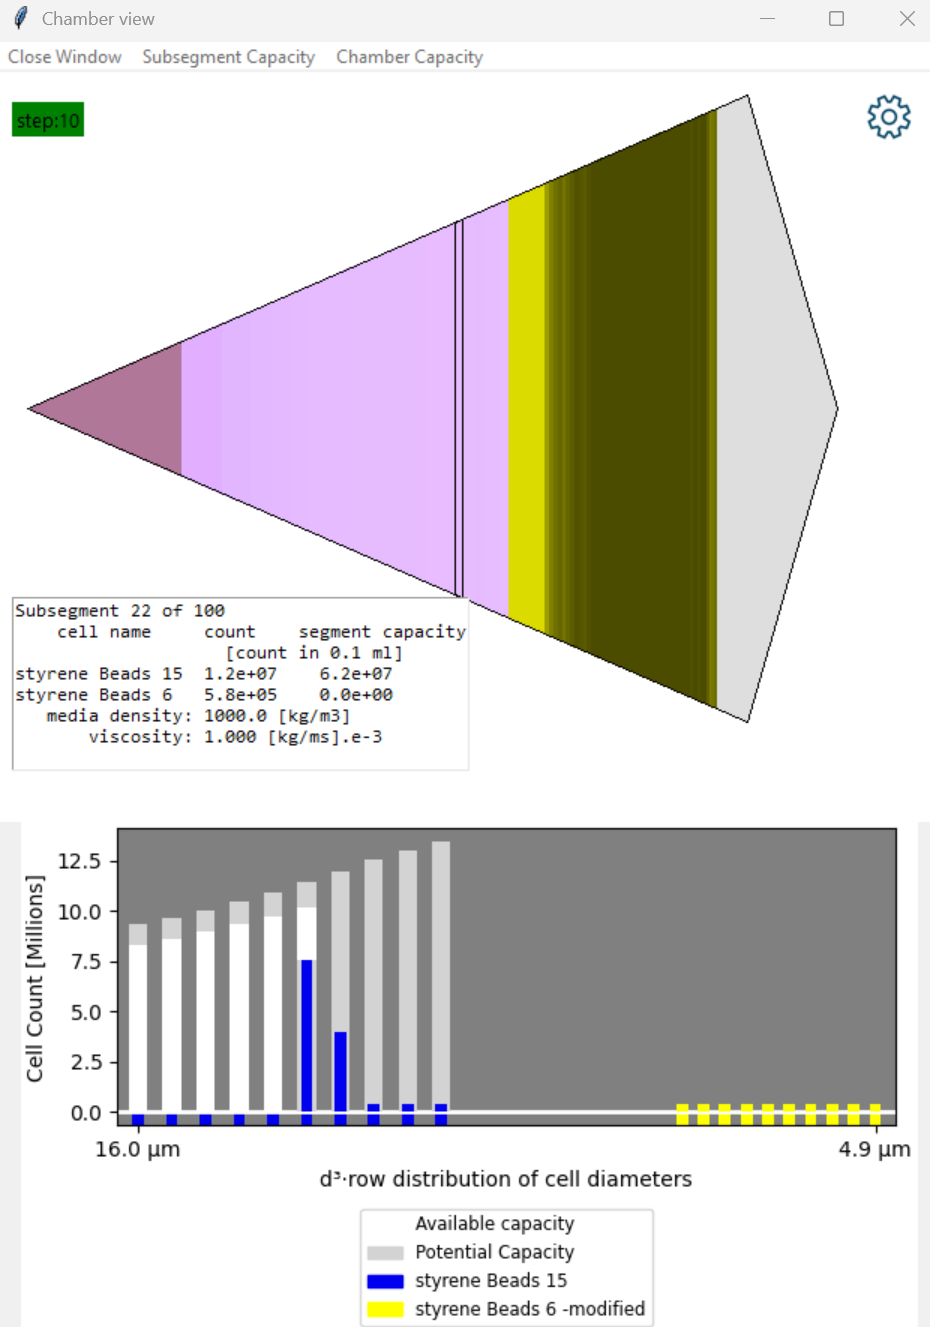
- Select a line in the protocol where cells are loaded in the chamber and pick 'Chamber View'.
- Select a subsegment in the chamber.
- Pick 'Subsegment Capacity' from the menu.
- There are two particle types: Blue and Yellow beads.
- The chart highlights how the size distribution bins for each cell are located in the 'process space'.
- At these settings there is capacity to accumulate blue beads but the yellow beads do not display any potential capacity.
- This means the yellow beads will be elutriated from this subsegment.
- Yellow beads are however present because they are 'washing through' and consume some of the volume that accumulating cells might use.
- The columns on the left of the chart represent the largest blue bead diameters.
- The grey bar is the 'Potential' to capture that bead size in the absence of other beads.
- The white bar is the 'Available' capacity if beads of this size are available. It is reduced by the presence of particles that are flowing through.
- The first blue bar is blue beads accumulating in this subsegment. It does not reach the top of the white bar becuase we have capured all these beads in earlier subsegments. The next size of blue bead is then able to accumulate here.
- The following low blue bars are blue beads passing through this subsegment.
Use Left / Right arrow buttons to step up and down the chamber
This display highlights how this model of the chamber is interacting with individual cells. It is far from perfect, and feedback is welcome. For the present it provides visibilty of cell interactions that the Guidelines can interpret to identify process hazards.
Recommended
- Explore a protocol with a single cell type.
- Explore a protocol with multiple, overlapping cell types, such as a leukopak.
Summary report

The summary report can be selected at any time once a protocol is loaded by selecting the menu on the left of the screen.
- The working directory for the protocol file is always displayed at the top of the report.
- When a protocol is first loaded, the report presents the descriptive text data that resides in the protocol file.
- This often includes important information for settings and kit set up anticipated by the protocol developer.
- Once the Modify File data has been applied, the report presents the simulation status to that point.
- The status of the simulation is described at the top of the report by the Status supported with a Score built from the FMECA data.
- The report then presents a summary of the settings used and outcomes of the simulation.
- Systematic loss of cells because of capture in kit segments is one valuable insight.
- The report is progressively refined and appended with each step of the simulation.
The Summary report can be saved as a pdf file optionally merged with the current guideline reports.
Hazard Analysis - Risk based evaluation
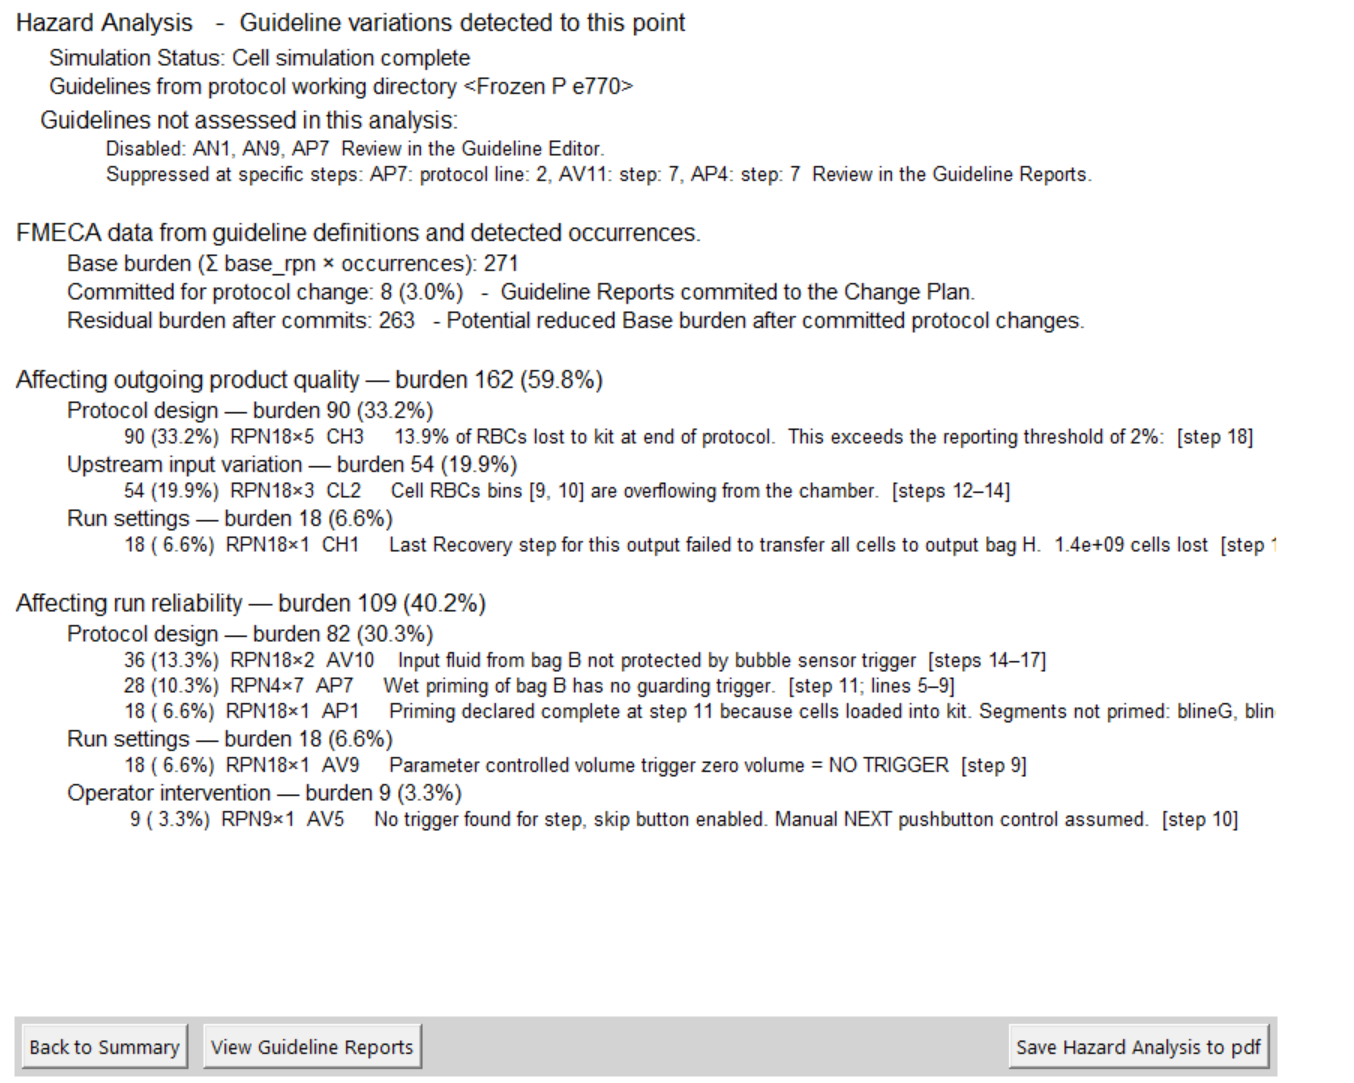
Open the View Hazard Analysis by selecting the button at the bottom of the 'i' Summary report screen.
The hazard analysis is built from a process FMECA. (Failure Modes, Effects and Criticality Analysis)
Each guideline represents one item from that analysis.
The Rotea Protocol review application is creating an environment so the occurrence of hazards can be detected.
The status of the simulation process is described at the top of the report by the Simulation Status.
Each step of the simulation - 'Volume Init', 'Volume Sim' and 'Cell Sim' enable different guidelines to be assessed so the report changes as the simulation progresses.
The FMECA score is derived from the 'base rpn' of the guidelines that are conflicted multiplied by the number of times it occurs in the protocol.
FMECA settings for each guideline can be edited in the GuideLine Editor
Where guideline reports have been marked for 'Commitment to protocol change', the potential improvement of the hazard analysis score based on these changes is displayed.
Guidelines
The purpose of this application is to compare a protocol, and the way it works, to a set of 'best practise' recommendations.
It is common to find guideline issues in protocols.
This tool is enabled when the volume
simulation has been initiated.
If the volume simulation is completed with no guideline
conflicts, our rather concerned face becomes:
The purpose of this application is to help you the user achieve this happy face for your protocol.
Guidelines have been developed through an FMECA process which is a methodology to identify process hazards that may occur, (or have been seen to occur.)
Each hazard is documented by:
- A description of the process condition
2.The reason or hazard associated with the condition
3.How to recognise that condition in the simulation
4.Mitigation methods that might be applied
5.Where appropriate settings and/or thresholds relevant to that guideline
6.A reference number
7.FMECA Severity, Occurrence and Detection default values.
The guidelines are documented in a protected file, RoteaProtocolGuidelines_default.json
If you have loaded a protocol, the Guideline Editor command will be illuminated. You can browse the guidelines and edit comments and settings.
If you make any changes, you will be prompted to save those changes. The default destination for the saved file is the working directory for the protocol.
The edited file 'RoteaProtocolGuidelines_Local.json', can be
applied to other protocols by copying the file to the working
directory of each protocol.
When a protocol is opened, the application checks if a local version
of the guidelines file has been saved in its working directory and
uses it. You can disable individual guideline reporting for your
applications by this method. You can also edit comments in the
guideline file and save them. This allows you to distribute your
opinions and suggested settings for the guidelines to others. (There
is no user identity or protocol content in this file.)
How do guidelines work?
- The guidelines are documented in the Rotea Protocol Guidelines file.
- Failure mode events are recognised as hard coded reviews within the process simulation.
- The purpose of the simulation is to create an environment where the guideline issues can be detected.
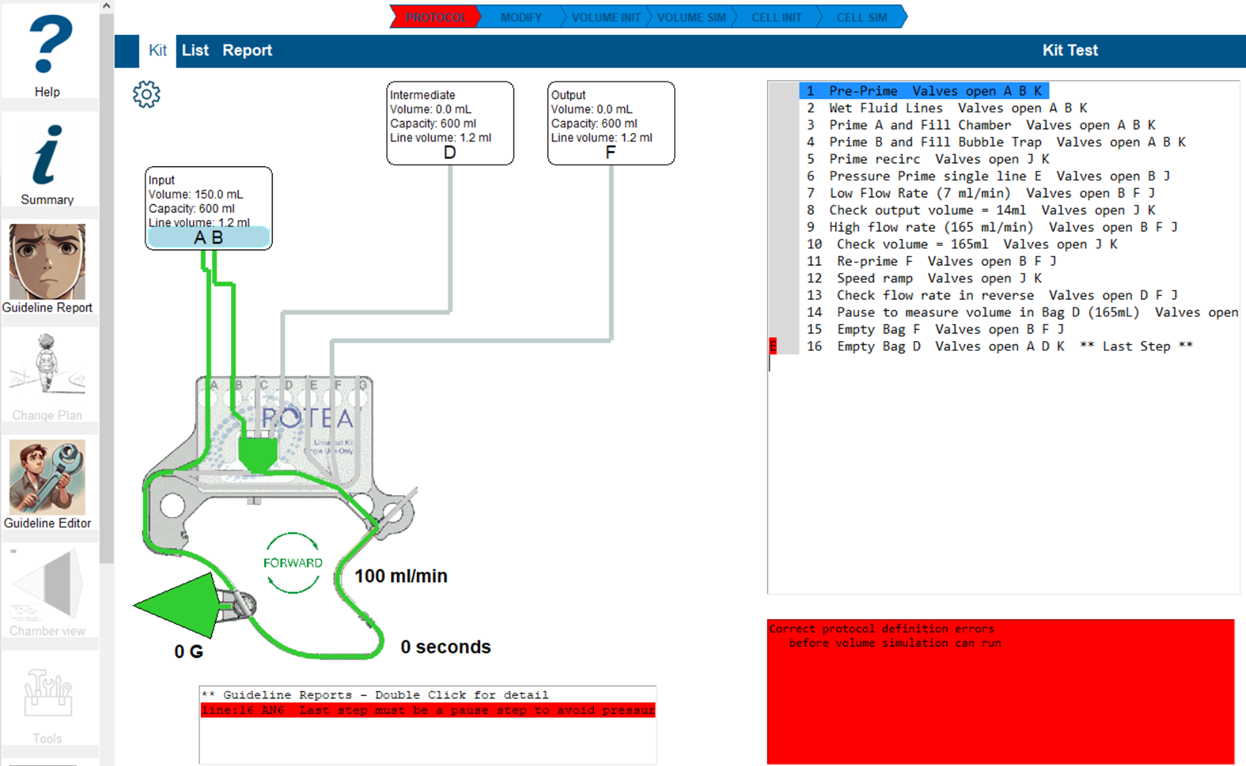
Example 1. Guideline AN6 Last step must be a pause step to avoid pressure fault.AlarmLevel:Error
- Review the guideline editor for an explanation of the fault.
- This is identified by scanning the protocol for the line where 'set as last step' is set and checking it is a Pause step.
Example 2. Guideline AV13 Input bag contents dry or un-primed at start of draw down. AlarmLevel: Error
- Review the guideline editor for an explanation of the fault.
- To recognise this event, we need to simulate the fluid flows in the protocol to understand the fluid state of the kit and bags at each step.
- To conduct the fluid simulation, information additional to the
protocol definition is required:
- The bag fluid starting volume and bag capacity
- Assignment of values to any user variables in the protocol such as harvest volume. (The minimum volume is used as a default)
Example 3. Guideline AV7 Bubble trap fails to capture bubbles from Pause loop. AlarmLevel: Warning
- Review the guideline editor for an explanation of the fault.
- To recognise this condition, the simulator needs to know the location of air and fluids in the process kit.
- The simulator recognises air in the kit and detects the pump flow rate is above the guideline threshold setting.
- The pump flow rate threshold can be adjusted in the guideline editor.
Example 4. Guideline CL2 Cells being lost from chamber because it is overloaded. AlarmLevel: Advice
- Review the guideline editor for an explanation of the fault.
- To recognise this condition we need to model the cells capacity to accumulate in the chamber.
- If the calculated holding capacity of the chamber is less than the number of cells, then cells will be washed out.
To conduct cell simulation we need a successful fluid simulation and further information beyond the basic protocol:
- Starting media and cell population definitions for all bags with fluid in them.
- The Rotea protocol builder can support these definitions, but they are not required for the run-time protocol.
Guideline Report tool
Reviewing guideline conflicts in your protocol
- Go to Kit view
- Select the line omn the step list of interest
- Double-click the guideline item of interest in the warning display
- The guideline report will be displayed.
Some guideline issues may occur before the volume simulation. Refer to Protocol Loading Errors to deal with errors so you can proceed in these situations.
Commonly the volume simulation will trigger a number of warnings, advice and error detections.
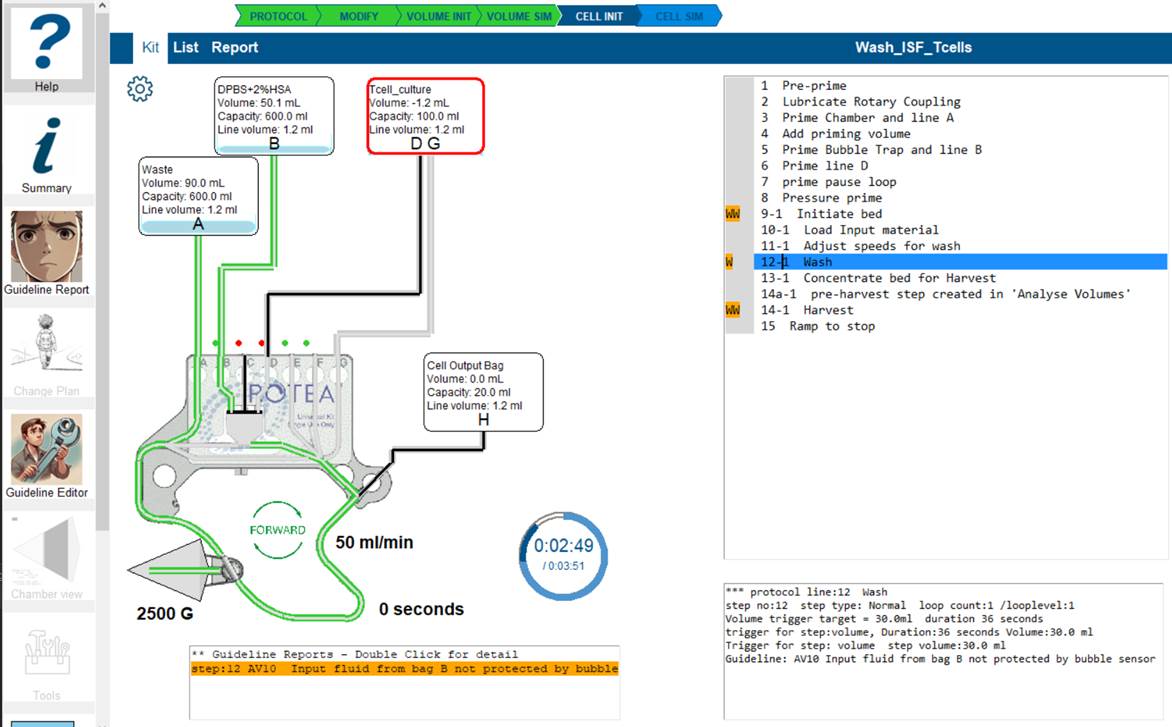
This simple protocol has successfully completed the volume simulation (Green VOLUME SIM arrow).In the line listing there are orange blocks 'W' being displayed.
- Click on the line of interest where an orange marker is displayed.
- The warning box is displayed below the kit details with the reports for this step.
- Double-click on the line of interest and the Guideline report screen will open.
You can also just click on the Guideline Report tool and navigate to the report from the list.
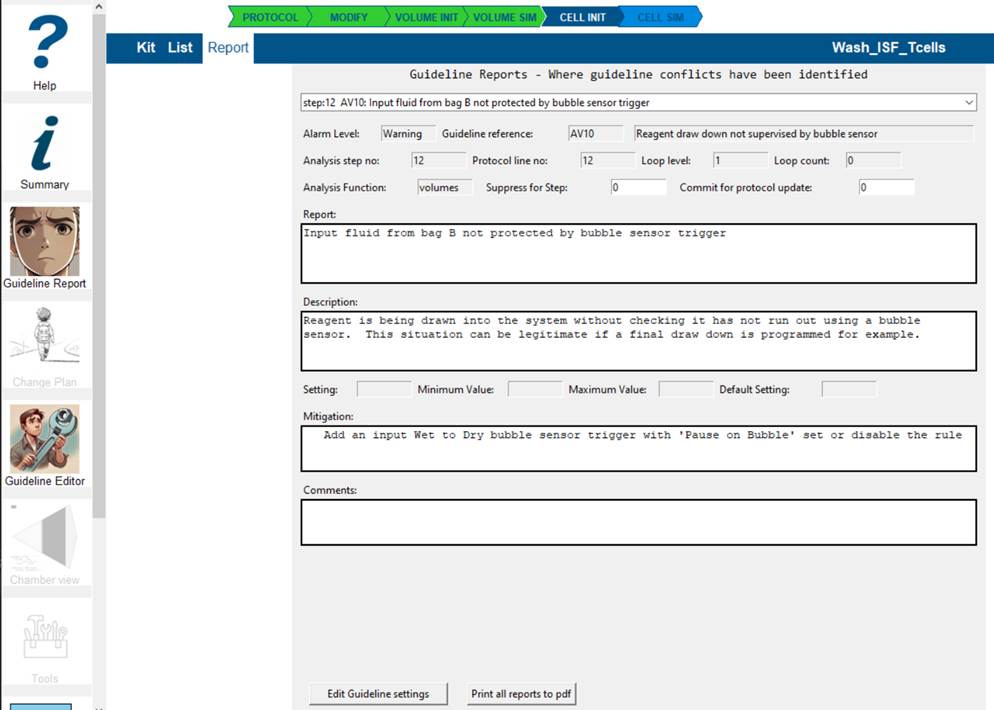
The report explains the reasoning for the conflict and allows you to:
- 'Commit' this step for inclusion in changes to the protocol by setting Commit for protocol update
- 'Suppress' this guideline for this step by setting Suppress for Step if you are sure the guideline is not valid in this step in your protocol.
- add comments that will be reported and transferred to any protocol change plan you propose.
You can go directly to guideline editor from here to adjust any settings or disable the guideline entirely for this protocol.
All guideline reports can be saved as a pdf by selecting that button.
The dropdown box enables you to scan the guideline reports and select which to review.
To exit the Guideline report screen, select the Kit or List buttons to return you to those screens. Selecting Report will return to current report view.
Guideline Errors
Guideline errors can be detected when loading a protocol, running the volume or cell simulation. The application prevents you from proceeding until you have addressed the error.
Warnings do not prevent progression of the simulations so you can observe the consequences.
Raising an error suggests this situation is not acceptable
practise and likely to result in a process failure. While you cannot
change the protocol, the guideline report allows you to
Commit the guideline for this step to a change
plan, or Suppress this fault for the step. A
commited report continues to be reported but no longer generates an
error state.
A suppressed guideline is ignored in the analysis but continues to
be displayed. Suppressing a guideline indicates you are confident
this condition is not valid for your protocol. You can also edit the
guideline settings in Guideline
Editor to globally disable it or change settings.
Dealing with guideline errors so you can proceed.
The guideline errors will be display in the list of lines. Go into 'Kit' view and select the line where the error is highlighted.
The 'Warning' box will include a highlighted line with the error summary. Double-click the line and Guideline editor will open the error report.
Select the 'Commit for protocol update' box and save the changes. This will reset the volume simulation. If you think this guideline is not relevant to this step, select 'Suppress for step' and save.
Select 'Kit' view to close the Guideline editor. Select another error report, or proceed with the analysis.
Commited and suppressed guidelines will be displayed as 'C' or 'S' in the simulation listing.
Guidelines you want to suppress for the entire protocol can be disabled in the 'Guideline Editor' tool
Creating a Change Plan

A change plan is a list of guideline reports that have been 'committed' for change of the protocol.
Delivered as a pdf file, it is designed to provide a formal decision path in situations where the protocol is a controlled document.
Adjustments to the guideline reports are retained in the Mod file but are deleted whenever a change to the protocol file is detected.Any changes to the protocol (through the Rotea protocol editor,) should include a change to its file name to preserve any change history.
The Change Plan tool is enabled when one or more guideline reports have been committed for protocol update.
All the committed guidelines can be reviewed and comments added.
- The change plan pdf can be generated by selecting 'Print protocol change plan to pdf'.
- The change plan includes the current hazard summary. To get the full hazard analysis, ensure cell simulation is completed before printing.
Guideline Editor tool

The guidelines are provided in a file
'RoteaProtocolGuidelines_default.json' that includes descriptions
and default settings. When a protocol is opened, the application
looks for a guidelines file in the working directory.
The filename is 'RoteaProtocolGuidelines_Local.json'.
If it is not present, the default guidelines are used. As a user,
you can copy the 'Local' guidelines file you want to use to other
protocol working directories, and share your settings and comments
with other users.
Rotea Protocol Editor
This is freeware available from ThermoFisher Scientific. Copy and paste these links in your browser to download:
DefiningMedia and Cell Populations in Rotea Protocol editor.
The protocol review application reads the protocol file to get step information including the bag data, the volumes and description or Label as described in the Bag Configuration screen of the Rotea protocol Editor.
Where possible this protocol review application tries to populate the bags with media and cell populations based on matching the Label of the bag in the Protocol Builder to standard names for media and cell populations stored in the application.
Media comprises one or more known media components mixed at a defined percentage ratio.
A cell population comprises media and one or more particles at a defined concentration per ml.
If you change the media or cell data in this application, those changes are stored in the Modify file. So to introduce new changes to the RotProcRev_settings.json or from the protocol Label, then reject use of the Mod file to allow the new settings to be employed rather than the previous settings.
Rotea Software manuals:
The Best Practise protocol design principals are largely contained in these reference documents. Copy and paste these links to your browser to download:
User Guide:
Process Design Guide:
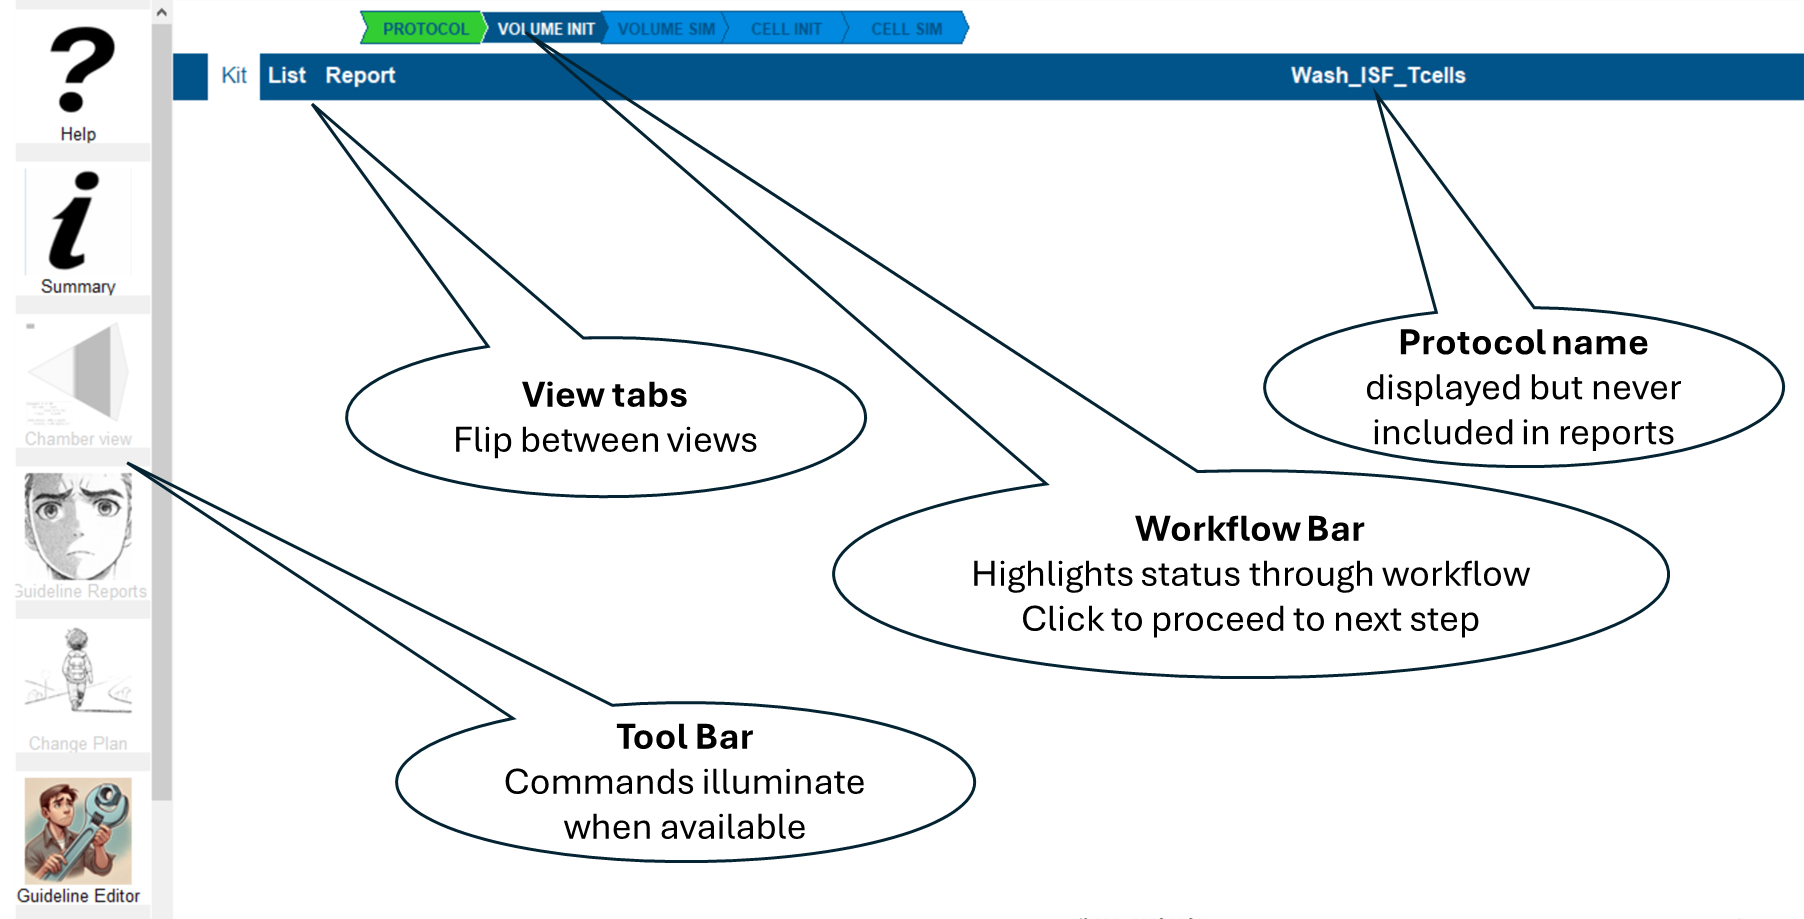
Navigation:
Licensing:
Creating a License request file
Access the license status screen with the 'License' tab in the application
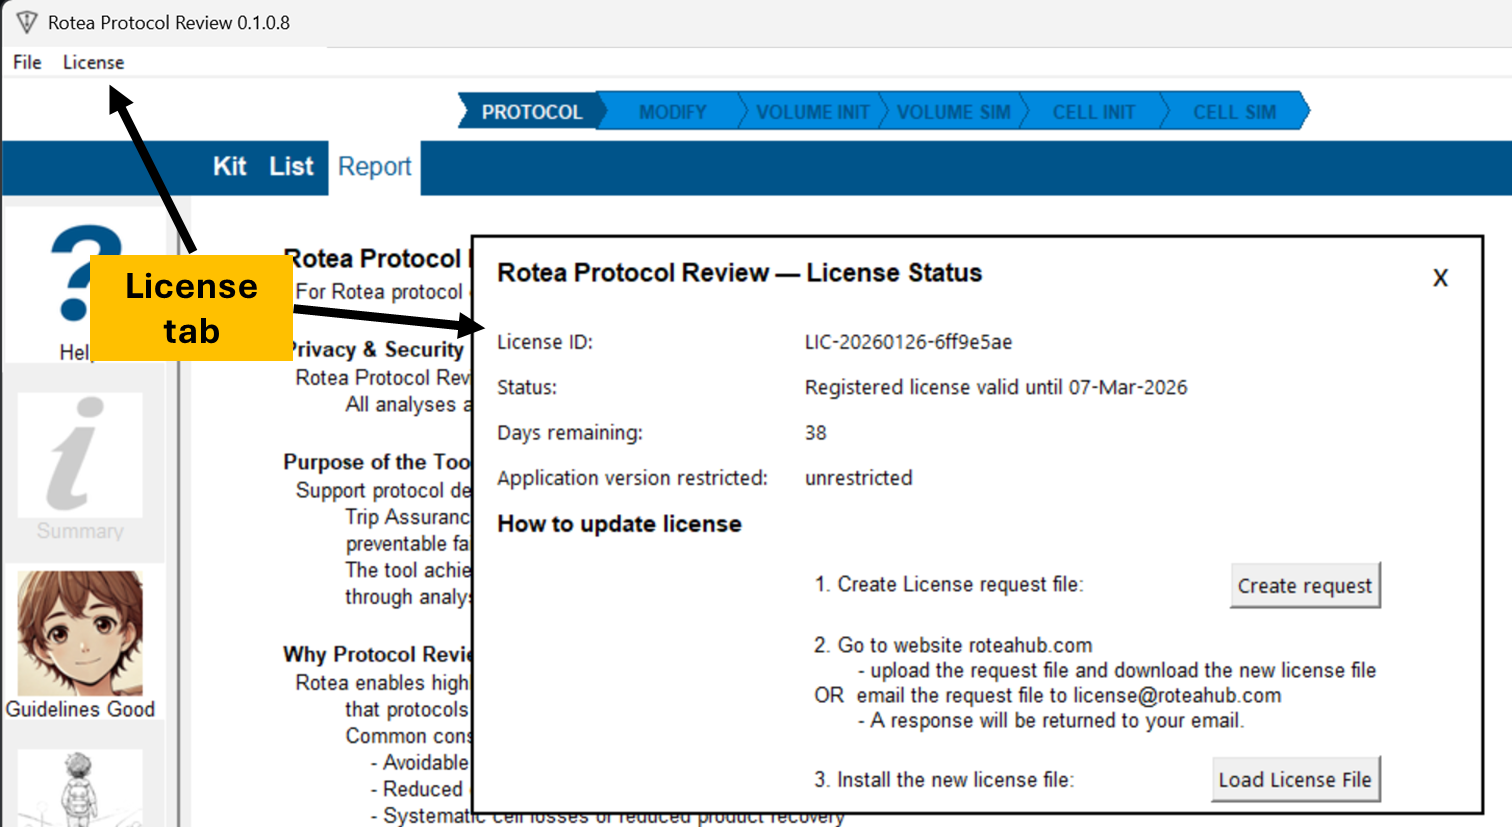
Select the 'Create request' option.
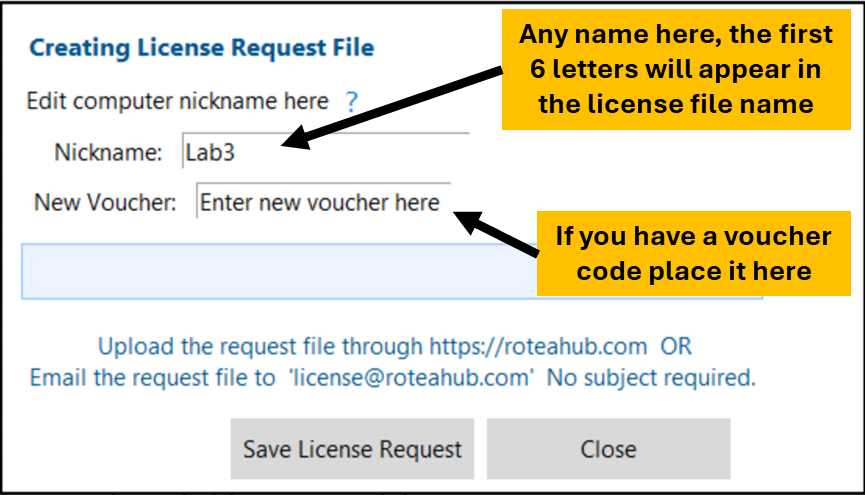
Complete the form. Once saved, you can copy the file for pasting in an email.
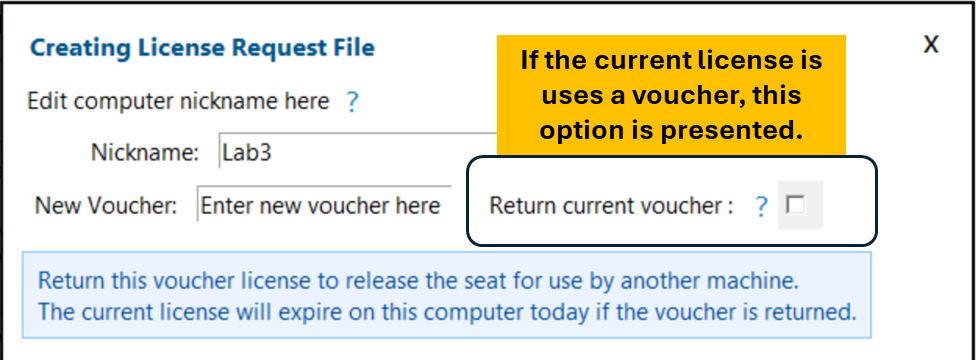
Returning a voucher makes the seat on that voucher available for another user or computer.
Sol2C Pty Ltd Last update 28 Jan 2026